


Identification of de novo mutations in A. thaliana
Col-0 mutation accumulation lines
Our training set of mutations was identified from 107 mutation accumulation lines of the A. thaliana Col-0 accession, which is the basis of the A. thaliana TAIR10 reference genome sequence12. The lines had been previously grown for 24 generations of single-seed descent before sequencing with 150-bp paired-end reads on the Illumina HiSeq 3000 platform, of pools of approximately 40 seedlings of each line from the 25th generation (Fig. 1a). Seedlings were sampled at the four-leaf stage, at 2 weeks of age. Variants were identified with GATK HaplotypeCaller12. In many organisms, germline mutations are primarily influenced by processes specific to reproductive organs10. Because plants may lack a completely segregated germline46, we hypothesized that mechanisms that influence local mutation rates in the germline may be reflected in the distribution of somatic mutations as well, or at least that the processes governing mutation rate variability across the genome may be similar in germline and somatic tissue. Therefore, in addition to the original variants called12, we implemented a custom filtering pipeline to identify a high-confidence set of additional de novo mutations (Extended Data Fig. 1). This set included, in addition to somatic variants, germline variants that had not been called in the original analyses12. Somatic mutations were previously excluded because they appear as heterozygous calls12. Germline mutations were previously excluded if at least 1 out of the 107 lines also included a putative somatic mutation at the same position12. On the basis of previously reported germline mutation rates (1–2 per genome and generation) and with the knowledge that these lines were self-fertilized each generation, we expected the seedlings that were sequenced to be segregating for 2–4 additional heterozygous germline variants, which would have been called as somatic mutations by our pipeline (approximately 2–5% of putatively somatic mutations). Because we combined putative somatic and germline mutations to characterize the mutational landscape of the A. thaliana genome, this did not have an obvious effect on our results.
Testing for mutation calling artefacts by resequencing ten siblings of a single-mutation accumulation line
To test for the possibility that our results were in part artefacts of the pooled-seedling sequencing approach12, we resequenced entire rosettes of individual plants that were sibling from the same mutation accumulation line (#73) and asked whether the distribution of called variants (that is, putative somatic mutations around TSS and TTS) was similar to the patterns seen with the seedling pools of the 107 individual lines described in the preceding section (Extended Data Fig. 6). Specifically, we grew 10 siblings of line #73 and extracted DNA from 3-week-old whole rosettes. Barcoded PCR-free libraries for the 10 siblings were sequenced, with 150-bp paired-end reads, at approximately 60× depth each on a single lane of the Illumina HiSeq 3000 platform. Additionally, for one sibling, the same library was sequenced in an independent lane at approximately 600× depth. After adapter and quality trimming with cutadapt (version 2.3) and removing duplicates with samtools markdup (version 1.10), reads were aligned to the TAIR10 reference genome with bwa-mem (version 0.7.17) and variants were called independently for each sample with GATK HaplotypeCaller version 4.1.0.
Measuring the effects of mappability of reads
We wanted to ensure that variation in mappability could not explain the observed distribution of de novo variants. To evaluate the possibility that results were an artefact of bias in mappability across gene regions, we calculated mappability for k = 100, e = 1, across the A. thaliana reference genome using GenMap47. We then plotted and visualized mappability around TSSs and TTSs to confirm that differences in mappability were not the same as the signals of mutation bias detected in our numerous datasets of de novo mutation. While we did not see any evidence that mappability bias covaried with patterns of mutation bias, for building our predictive model of mutation rate as a function of epigenomic and other features, we still chose to filter out variants called in regions of poor mappability (±100 bp of mappability < 1), as our analysis of resequenced siblings suggested that variants called in low-mappability regions are more likely to be false positives (since variants called in many independent lines had lower mappability).
Simulating reads and identifying true false positives
To further rule out artefacts, we calculated the expected distribution of false positives using simulated short reads. We simulated Illumina reads based on the TAIR10 reference genome using ART48 with the following parameters: -l 150 -f 30 -m 500 -s 30. Reads were mapped to the TAIR10 genome with NextGenMap, the same caller as used in the original calling of mutation accumulation lines49, and variants were called with GATK HaplotypeCaller. This was repeated for a total of 1,000 simulated genomes. Because these are simulated reads, all variants that are called must be false positives. To test the possibility that the main results found in this study, such as elevated mutation and polymorphism upstream of TSSs, are artefacts of bias resulting from Illumina sequencing (which is included in simulations) or from mapping error (which is captured by mapping the simulated reads), we plotted the distributions of false positives around these regions to confirm that the distribution of false positives was more similar to likely false positives (for example, called in many lines) and unlike the higher confidence variants called in real sequencing data.
Identification of de novo mutations in a new A. thaliana mutation accumulation experiment
To validate our predictive model of the mutation probability score, we used a second A. thaliana mutation accumulation experiment descended from eight founders collected in natural environments50. The lines were grown for seven to ten generations of single-seed descent before 150-bp paired-end read Illumina sequencing of pools of 40 seedlings. The specifics of the populations were as follows: founder CN1A18: 56 lines for 10 generations; founder CN2A16: 51 lines for 10 generations; founder SJV12: 48 lines for 7 generations; founder SJV 15: 36 lines for 7 generations; founder RÖD4: 50 lines for 8 generations; founder RÖD6: 50 lines for 8 generations; founder SB4: 53 lines for 8 generations; and founder SB5: 56 lines for 8 generations. Mutations were identified as described in ref. 11. Briefly, raw reads were mapped to the TAIR10 reference genome, variants were called using GATK HaplotypeCaller, merged with the GenotypeGVCFs tool and filtered by variant quality (QD > 30) and read depth (DP > 3). A germline mutation was called if a single mutation accumulation line per founder population had a homozygous alternative allele. Somatic mutations were called as heterozygous variants found in only one of the mutation accumulation lines derived from a single founder genotype. This should remove any true heterozygous calls, variants between cryptic duplications in the founder, and low confidence calls, as suggested by our preceding analyses by resequencing siblings from the original mutation accumulation experiment.
Identification of de novo somatic mutations in a resequencing dataset of A. thaliana leaves
To further test our power to predict the distribution of de novo mutations in an independent experiment, we used published data generated from Illumina sequencing of 64 samples of leaf tissue (rosettes and cauline leaves) of two Col-0 plants21. Raw fastq files were downloaded from NCBI and mapped to the TAIR10 reference genome using bwa-mem, and duplicate reads (that is, PCR duplicates) were filtered using samtools markdup. Variants for every sample were called with GATK HaplotypeCaller. Variants were filtered to include only those found in a single sample (as our previous work had already shown that putative somatic variants called in many independent samples tend to be enriched for regions of low mappability and exhibit distributions more similar to the expected distribution of false positives).
De novo mutations in a natural mutation accumulation lineage
We analysed mutations that had accumulated in a single A. thaliana lineage that recently colonized North America32. The 100 samples came both from modern populations as well as historical herbarium specimens and contained 8,891 new variants with at least 50% genotyping rate in the population. Phylogenetic coalescent analyses indicated that these 100 samples shared a common ancestor around 1519–1660, presumably the ancestor that colonized North America, and thus that these lines have recent mutations that accumulated after a population bottleneck (small Ne) and therefore under weak selection32. We used these to study the level of polymorphisms around TSSs and TTSs in a wild population with a simple demographic history.
Constructing a model to predict mutation probability
Sequence and epigenomic features
We were interested in studying epigenomic features plausibly linked to mutation rate16,17,18,19,28,51,52,53,54,55. To build a high-resolution predictive model of mutation rate variation, we extracted or generated data describing genome-wide sequence and epigenomic features. First, we calculated GC content (% of sequence), which can affect DNA denaturation5,25,56,57,58, across regions9,23,59,60,61,62,63,64. From the Plant Chromatin State Database, we also downloaded 62 BigWig formatted datasets characterizing the distribution of histone modifications14 H3K4me2, H3K4me1, H3K4me3, H3K27ac, H3K14ac, H3K27me1, H3K36ac, H3K36me3, H3K56ac, H3K9ac, H3K9me1, H3K9me2 and H3K23ac, many of which have been linked to mutational processes8,9,11,12,19,33,65,66,67,68,69,70. For each specific histone modification, depths were scaled (0 to 1) and averaged across each region for downstream analyses.
Col-0 cytosine methylation
Because cytosine methylation is known to affect mutation rates via deamination of methylated cytosines9,11,12,33,66, we wanted to include cytosine methylation as a predictor variable in our model. Methylated cytosine positions for Col-0 (6909) wild-type leaves were obtained from the 1001 Epigenomes dataset GSM1085222 (ref. 71) under the file GSM1085222_mC_calls_Col_0.tsv.gz. Because the context of cytosines can vary and influence the functional effect of methylation, cytosines were further classified into three categories (CG/CHG/CHH) for all downstream analyses. For each region, we calculated the number of methylated cytosines in each category per bp.
Chromatin accessibility
ATAC-seq can measure chromatin accessibility, which also affects mutation rates9,11,12,33,66,72. Col-0 seeds were stratified on MS-agar (with sucrose) plates at 4 °C for 4 days in the dark. Plates were transferred to 23 °C long-days and kept vertically for easier harvesting of seedlings. On the eleventh day of light exposure, 10–20 seedlings each from three MS-agar plates were fixed with formaldehyde by vacuum infiltration and stored at −80 °C.
Fixed tissue was chopped finely with 500 µl of general purpose buffer (GPB; 0.5 mM spermine•4HCl, 30 mM sodium citrate, 20 mM MOPS, 80 mM KCl, 20 mM NaCl, pH 7.0, sterile filtered with a 0.2-µm filter, followed by the addition of 0.5% of Triton-X-100 before usage). The slurry was filtered through one-layered Miracloth (pore size: 22–25 µm), followed by filtration through a cell strainer (pore size: 40 µm) to collect nuclei. Approximately 50,000 DAPI-stained nuclei were sorted using fluorescence-activated cell sorting (FACS) as two technical replicates. Sorted nuclei were heated to 60 °C for 5 min, followed by centrifugation at 4 °C (1,000g for 5 min). Supernatant was removed, and the nuclei were resuspended with a transposition mix (homemade Tn5 transposase, a TAPS-DMF buffer and water) followed by a 37 °C treatment for 30 min. 200 µl SDS buffer and 8 µl 5 M NaCl were added to the reaction mixture, followed by 65 °C treatment overnight. Nuclear fragments were then cleaned up with Zymo DNA Clean & Concentrator columns. 2 µl of eluted DNA was subjected to 13 PCR cycles, incorporating Illumina barcodes, followed by a 1.8:1 ratio clean-up using SPRI beads. Genomic DNA libraries were prepared using the same library preparation protocol from the Tn5 enzymatic digestion step onwards.
Each technical replicate (derived from nuclei sorting) was sequenced with 3.5 million 150-bp paired-end reads on an Illumina HiSeq 3000 instrument. The reads were aligned as two single-end reads to the TAIR10 reference genome using bowtie2 (default options), filtered for the SAM flags 0 and 16 (only reads mapped uniquely to the forward and reverse strands), and converted separately to .bam files. The .bam files were merged, sorted, and PCR duplicates were removed using picardtools. The sorted .bam files were merged with the corresponding sorted bam file of a second technical replicate (samtools merge –default options) to obtain a final depth of approximately 6 million reads for each replicate.
Peaks were called for each biological replicate using MACS2 using the following parameters:
macs2 callpeak -t [ATACseqlibrary].bam -c [Control_library].bam -f BAM –nomodel –shift −50 –extsize 100 –keep-dup=1 -g 1.35e8 -n [Output_Peaks] -B -q 0.05
Peak files and .bam alignment files from three biological replicates were processed with the R package DiffBind to identify consensus peaks that overlapped in at least two replicates (FDR < 0.01). Library quality was estimated by measuring the frequency of reads in peak (FRIP) scores for all three replicates, which were 0.36, 0.36 and 0.39, above the standard quality threshold of 0.3.
Gene expression
Gene expression was calculated as the mean across 1,203 accessions71, from which we also extracted the genetic variance (Vg) and environmental variance (Ve) as well as the coefficient of variation (variance/mean) in expression for each gene. This dataset provided information for 17,247 genes with complete data.
Predictive model of mutation rates
We wanted to ask whether intragenomic mutation variability in the genome could be predicted by features of the genome that previous work had shown to have potential or demonstrated relationships with mutations. To model mutation rate genome-wide at the level of individual genes, we created a generalized linear model. The response variable was the untransformed (that is, assuming normality, to avoid risk of increased false positives caused by transformation73,74) observed mutation rate across every genic feature (upstream, UTR, coding, intron and downstream). The predictor variables were GC content, classes of cytosine methylation, histone modifications, chromatin accessibility and expression of each gene. From this full model, a limited predictive model was selected on the basis of forward and backward selection with the lowest AIC value by the stepAIC function in R. These models were created separately for indels (adjusted R-squared: 0.001791; F-statistic: 34.6 on 16 and 299635 d.f.; P < 2.2 × 10⁻¹⁶) and SNVs (adjusted R-squared: 0.0009687; F-statistic: 37.32 on 8 and 299643 d.f.; P < 2.2 × 10⁻¹⁶). For downstream analyses, we used the predicted mutation probability (the mutation probability score) based on these models (predicted SNVs + indels) for genes, exons and other regions of interest from the TAIR10 genome annotation. While the linear regression approach used here enables hypothesis testing to some extent (one can generate confidence intervals and P values describing the level of significance of individual effects), our primary goal was to create a predictive model of mutation bias as a function solely from genomic and epigenomic features; the causality of the associations uncovered in these analyses for individual predictors must be confirmed with future functional work.
Variance inflation factor
To test whether our results were skewed by overly correlated predictor variables (included in the model even after model reduction by minimizing AIC), we explored models where predictor variables were manually removed on the basis of their variance inflation factor score. Specifically, we used the vif function from the R package car to calculate variance inflation factor scores for each variable in our best AIC models for SNVs and indels. We then removed all variables with scores below 3. We recalculated mutation probability scores for every genomic feature. Because the resulting predicted mutation probability scores were very similar, with Pearson correlation r = 0.95 between gene-level mutation probability scores from the full model and the reduced model, we report only results based on the full model.
Analysis of natural polymorphism rates
Rates of polymorphism among genic exons
We calculated rates of natural polymorphism across exons in TAIR10 gene models from sequence variation among 1,135 natural A. thaliana accessions35. These analyses revealed elevated polymorphism rates in peripheral (first and last) exons. To test whether this is an artefact unique to A. thaliana, we calculated rates of natural polymorphism across exons from sequence variation among 544 P. trichocarpa accessions75. Specifically, we downloaded VCF and annotation data from Phytozome (v3.0) and calculated rates of variation across exons grouped by order (from 5′ to 3′) and total exon number.
Signatures of selection and constraint from natural populations
We calculated gene-level summary statistics for signatures of selection and constraint in the following way. Synonymous and non-synonymous polymorphism among natural A. thaliana accessions and divergence from A. lyrata (Pn, Ps, Dn and Ds, respectively) were calculated using mkTest.rb (https://github.com/kr-colab). The alpha test statistic for evidence of selection, which is a derivative of the McDonald-Kreitman test76,77,78, was calculated from these values for each gene where data were available (not all genes have orthologues assigned in A. lyrata) as 1 − (Ds × Pn)/(Dn × Ps). Positive values of alpha are conventionally interpreted as evidence of positive selection because non-synonymous variants in genes with such values tend to become fixed. For each decile of genes classified according to mutation probability, we calculated the proportion for which alpha is positive. Enrichment of non-synonymous variants compared to genome-wide average were confirmed by independent calculation of Waterson’s diversity estimate (θ) of non-synonymous variation. The frequency of loss-of-function mutations was calculated as before79,80, where loss of function was defined as premature stop codons and frameshifts disrupting at least 10% of the coding region of the canonical gene model. Genes experiencing purifying selection should exhibit lower levels of natural polymorphism than what would be predicted by mutation rate alone. To test this, we built a linear model of coding region polymorphisms as a function of predicted mutation rates. We calculated scaled residuals for each gene and tested whether they are more negative in genes expected to be under purifying selection. To estimate constraints on gene regulatory function, we looked at average expression across diverse genotypes. We also tested for relationships between predicted mutation rates and the coefficient of variation in gene expression, additive genetic variance for gene expression across diverse genotypes, and environmental variance in gene expression71.
Relationships between epigenomic and other features, mutation rates and gene function
The preceding analyses revealed significant associations between epigenomic and other features and signatures under selection indicating that genes that experience purifying selection are enriched for features associated with low mutation rate. To further dissect the mechanistic basis of this pattern, we wanted to directly test for relationships between epigenomic states, mutation rates and gene function. We analysed gene ontology categories for genes in the top and bottom deciles ranked by predicted mutation rate81, reporting gene ontologies that were significantly enriched in these groups after Bonferroni adjustment of raw P values.
We also analysed a manually curated dataset of mutation-induced lethality obtained from phenotyping lines with loss-of-function mutations37. Genes annotated as lethal effect when mutated (that is, required for viability) were compared with genes showing non-lethal phenotypic effects to assess differences in epigenomic and other features.
We analysed a dataset of phenotypes from 2,400 A. thaliana knockout lines38. Genes had been classified as being essential (such as an RNA processing gene where loss of function results in lethality82), causing morphological defects (for example, altered stomata and trichome size), cellular biochemical defects (for example, intracellular transport of small molecules) and conditional defects (for example, effects depending on the environment). We then compared epigenomic and other features in essential genes to other classes of genes. These analyses showed that genes with essential functions were enriched for features associated with reduced mutation, whereas genes annotated as having non-essential functions were depleted for these features.
Estimating selection on different types of de novo mutations
Synonymous, non-synonymous and stop-gained variants are expected to have different effects on gene function, although they are of the same mutational class (SNVs). They are all from coding regions, which have an overall mutation probability that is distinct from other regions of the genomes, such as introns, in our model of de novo mutations. For comparison, we calculated the rates of synonymous, non-synonymous and stop-gained SNVs in natural populations of A. thaliana, which have been subject to long-term natural selection. We also derived an expected null ratio of non-synonymous to synonymous mutations using knowledge on the relative base composition of all coding regions in the reference genome, the relative proportion of coding region mutations (for example, CG to TA mutations are most common), and the proportion of all possible codon transitions that lead to synonymous versus non-synonymous mutations. Ratios of non-synonymous to synonymous and stop-gained to synonymous mutations were compared between observed de novo mutations and those observed in natural populations or the null expectation by chi-squared tests.
Expected non-synonymous-to-synonymous substitution ratios in the absence of selection
To further validate that the observed de novo mutations we used to train our mutation probability model were not subject to appreciable selection, we simulated 10,000 de novo mutations across the Arabidopsis genome with custom scripts in R. Mutations in coding regions were randomly assigned to non-synonymous or synonymous changes based on codon use and observed mutational spectra of coding regions. We then calculated the observed ratio of non-synonymous to synonymous mutations in the simulated data. We repeated this simulation 10,000 times to produce a distribution of expected non-synonymous-to-synonymous ratios. We then compared the non-synonymous-to-synonymous ratio in our observed de novo mutations to this distribution. Finally, we tested whether our observation fell within the 95% bootstrapped interval.
Expected number of synonymous mutations under random variation
Because we had found that observed mutations were less frequent in coding regions, we wanted to determine whether this difference was significantly higher than expected by chance. We therefore asked how the number of synonymous mutations observed compared with that expected under a random process, starting with a simulated set of random mutations across the genome. We calculated the number of these mutations in coding regions that are expected to lead to a synonymous nucleotide substitution based on codon use and observed mutational spectra of coding regions. We repeated this simulation 1,000 times to generate a distribution of expected synonymous mutations. Comparing our observed de novo synonymous mutations to the mean of this distribution, we calculated the reduction in the observed synonymous mutation rate.
Non-synonymous-to-synonymous ratios and mutation probabilities in more deleterious (‘lethal effect versus non-lethal effect’) genes
We wanted to test whether the rates of non-synonymous-to-synonymous variation were lower in genes that are predicted to experience stronger negative selection. We split genes with a high-essentiality and low-essentiality prediction score (see above) or empirically determined lethal versus non-lethal effects of loss-of-function alleles (see above)37. We then calculated the differences in the observed mutation rate between these groups of genes and compared them with a t-test. We also calculated the number of observed non-synonymous and synonymous SNVs in these groups of genes and compared their ratios by a chi-squared test.
Non-synonymous-to-synonymous ratios in mutation probability deciles
We wanted to test whether mutation probability deciles predicted by our model differed in their rates of non-synonymous to synonymous mutations in our observed de novo mutations. If there was a strong gradient (for example, if genes predicted to have low mutation rate had lower rates of non-synonymous variation than genes predicted to have high mutation rate), this could suggest an effect of purifying selection acting directly on the detected mutations. To improve the power to detect differences among genes differing by mutation probability scores, we also assigned mean expression values to genes for which expression could not be called in our expression dataset71 and calculated mutation probability score. We binned genes into mutation probability deciles and compared mutation deciles and their corresponding non-synonymous-to-synonymous ratio to confirm that there was no relationship suggestive of selection.
Minor allele frequencies in natural populations
Our results had indicated that mutation rates were high upstream and downstream of genes relative to the gene bodies, not only in observed and predicted de novo mutations but also in natural polymorphisms. If this pattern was driven by mutation bias, we would expect to see lower minor allele frequencies upstream and downstream of genes, because this would indicate the presence of newly derived alleles from recent mutation rather than lower minor allele frequency caused by greater negative selection since we expect a priori that gene bodies (particularly coding regions whose code makes them sensitive to mutation) are subject to greater constraint. Conversely, lower minor allele frequencies in gene bodies would be consistent with the action of purifying selection in gene bodies, because lower allele frequencies are expected when negative selection had an opportunity to reduce allele frequencies. We therefore calculated the minor allele frequency (vcftools –freq) and their mean for every polymorphic position in the genome of 1,135 natural A. thaliana accessions35 in relation to TSSs and TTSs across the entire genome.
Tajima’s D around gene bodies
Tajima showed that reduced mutation and purifying selection, while having the same effect to reduce the number of polymorphisms, have opposite effects on his statistic, D36. That is, mutation rate has a scaling effect on D such that reduced mutation rates lead to less negative D, whereas purifying selection leads to more negative D. Therefore, analysis of D can be used to quantify the relative importance of these alternative, but not mutually exclusive, forces shaping rates of sequence evolution. D is, on average, negative across the A. thaliana genome, and D also scales with mutation rate. Thus, if D is more negative in regions with lower polymorphism, this could indicate that purifying selection is the dominant force underlying lower rates of variation. By contrast, if D is less negative in regions of low polymorphism, this would indicate that lower mutation rate is the primary force responsible for lower rates of variation. Therefore, to further investigate whether the observed rates of polymorphism around gene bodies in 1,135 natural A. thaliana accessions were driven at least in part by mutation biases or only by selection, we calculated Tajima’s D (vcftools –TajimaD) in 100-bp windows across the entire genome and averaged these values in relation to TSSs and TTSs for every gene. We used bootstrapping (n = 100) to calculate the confidence interval (±2 s.e.m.) around this mean value.
Tajima’s D in exons
We used Tajima’s D to estimate the extent to which mutation bias rather than selection after random mutation could explain differences in rates of natural polymorphism in exons (elevated polymorphism in peripheral exons). We calculated Tajiima’s D in every exon and grouped genes according to their total number of exons and plotted the average Tajiima’s D in relation to exons ordered from 5′ to 3′ ends. Tajima’s D was consistently more negative in peripheral exons, reflecting the effects of increased population mutation rate in these loci, so we further investigated the underlying causes by testing whether genes with and without (and longer or shorter) UTRs have differences in Tajima’s D in peripheral exons. Finally, we asked whether genes with more and longer introns have less negative Tajima’s D values, to test whether the lower rates of polymorphism observed in these genes was caused at least in part by reduced mutation rate, rather than selection after random mutation.
Simulations of mutation bias and selection using SLiM
Our observation that Tajima’s D is less negative in regions of low polymorphism, such as gene bodies, suggested that the reduced polymorphism therein is caused by a lower mutation rate, consistent with the mutation biases that we discovered in the analysed mutation datasets. To verify this interpretation, we conducted simulations using the software SLiM (v3)83. These simulations modelled genic and intergenic space, based explicitly on the first 100 genes on chromosome 1. For each simulation, we modelled a population of 1,000 individuals for 10,000 generations. The selfing rate was assigned to 0.98, a low estimate based on field observations84,85. The baseline mutation rate (per base and per generation) was derived from the empirically measured population mutation rate13 (from Ne = ~300,000, u = ~1 × 10⁻⁹ and adjusted for Ne = 1,000). Recombination rate (probability per genome per generation) was 1 × 10⁻⁴. To investigate the effects of mutation bias and selection, we assigned a scaled mutation rate in gene bodies of 0.2, 0.5 or 1, reflecting an 80%, 50% or 0% reduction relative to the baseline mutation rate in intergenic spaces. We also assigned proportions of deleterious mutations to be 0, 0.1 and 0.3, reflecting a 0%, 10% and 30% frequency of deleterious mutations independently in gene bodies and intergenic regions. All possible combinations of the three parameters were then simulated 200 times. Tajima’s D was calculated across the entirety of each genome in 100-bp windows using VCFtools. The position of each window was calculated in relation to the TSSs and TTSs of each gene. Counts of polymorphisms and Tajima’s D were averaged across all genomes in 10-bp windows for regions 3 kb upstream and downstream of the TSS and TTS of each gene. The variation in polymorphism level and Tajima’s D values were compared with theempirical observations of natural polymorphisms in 1,135 natural A. thaliana accessions66 using Pearson correlation.
Relationship between mutation probability, epigenomic and other features, and breadth of expression across tissues
Because we found that essential genes have higher levels of epigenomic and other features that lower predicted mutation rates, we wanted to further test the hypothesis that essential housekeeping genes were also enriched for such features and therefore experience a subsequently lower probability of mutation and lower de novo mutation calls. We used gene expression data from 54 tissues39. We calculated the correlation between the number of tissues with expression of more than 0 and either the predicted mutation probability score or the observed mutations for each gene. Because these results confirmed that genes expressed in more tissues have lower predicted mutation probability scores, we examined epigenetic features H3K4me1, H3K36me3 and CG methylation, which are enriched in essential genes, finding that genes expressed in all tissues were also enriched for these features.
Determining the effect of strong purifying selection on coding sequences
Our results had revealed significant biases in mutation probability in relation to gene bodies. Because we had found that mutations were significantly higher upstream of genes and significantly lower within gene bodies in five independent datasets, we considered the possibility that this overwhelming bias was the result of extremely strong purifying selection on de novo mutations (that is, removal of lethal mutations before they could be detected by us). We therefore simulated 10,000 random mutations across the TAIR10 genome. If mutations fell within coding regions, we randomly assigned them to be removed by selection (that is, dominant lethal). For this, we explored three levels of selection: s = 0.01 where 1% of mutations were removed (that is, had lethal effects), s = 0.1 where 10% of mutations were removed, s = 0.2 where 20% of mutations were removed, or s = 0.3 where 30% of mutations were removed. While s = 0.3 represents an exceptionally and unexpectedly high level of selection, especially in soma, evidenced by empirical estimates of the extent of gene essentiality in A. thaliana, this served as a positive control for observing the effects of extraordinarily strong selection on the expected distribution of mutations in a random mutation model.
Comparing expected and observed levels of synonymous mutation
Because we had observed a significant reduction in mutation rate in coding regions, we wanted to test whether this was driven only by functionally impactful mutation (for example, amino acid substitutions). To do so, we simulated 6,182 random SNVs. For each variant, we asked whether it was found within the coding region of any gene. We counted the total number of coding region variants and multiplied this number with the expected fraction, 0.28, of synonymous variants based on A. thaliana codon usage and mutation spectrum. We iterated this simulation 100 times to produce a confidence interval of expected synonymous variants in our training set of de novo mutations.
Reporting summary
Further information on research design is available in the Nature Research Reporting Summary linked to this paper.
More News
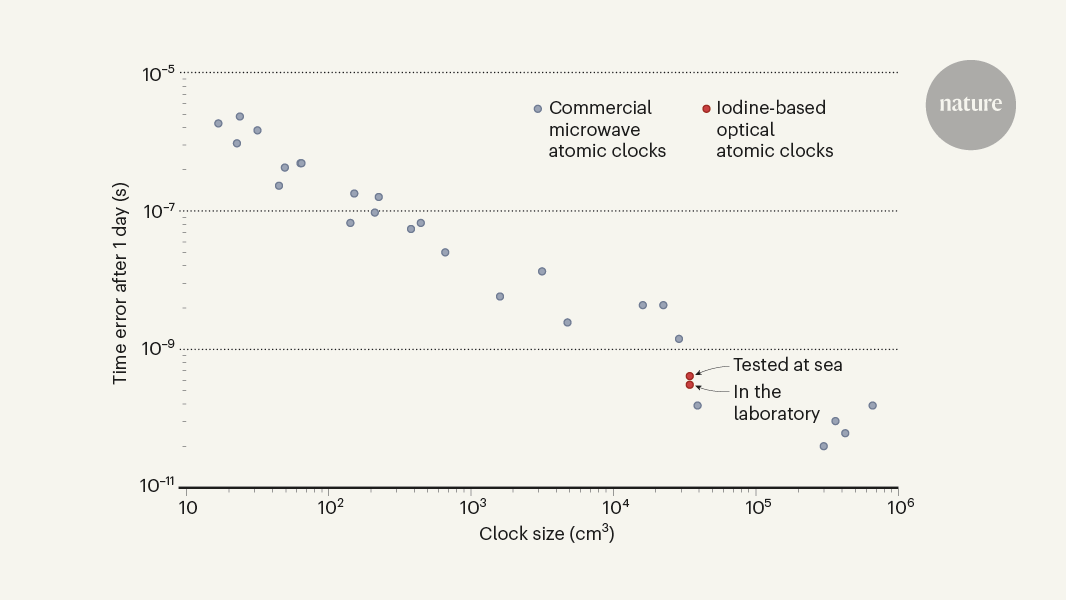
Robust optical clocks promise stable timing in a portable package
Marsupial genomes reveal how a skin membrane for gliding evolved
Galaxy found napping in the primordial Universe