


The positive and negative feedback processes operating within the coupled climate–social system are critical to understanding system behaviour and dynamics. The feedback processes that are represented in the model were identified in a two-step process. First, potentially relevant system feedback processes were described during a four-day interdisciplinary workshop. Second, targeted searches were conducted across relevant literatures in psychology, economics, sociology, law, political science and engineering to evaluate the evidentiary literature for or against candidate feedback processes, resulting in eight key feedback processes being included in the final model. This section briefly describes each feedback process, and Table 1 and Fig. 1 describe how these feedback processes are coupled together in the model and the model structure.
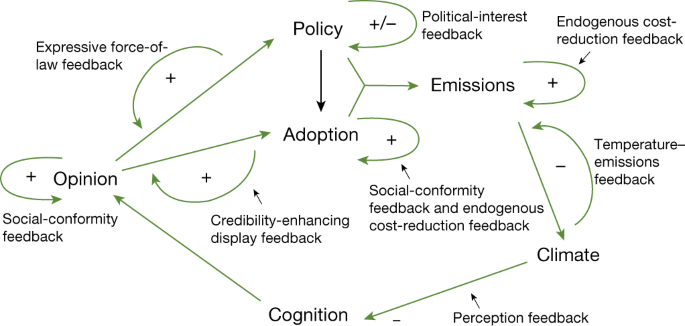
Components are shown in black and the model feedback processes in green. Feedback processes are identified as positive (+) (that is, reinforcing) or negative (−) (that is, dampening). The black arrow shows a connection between components (policy-adoption effect) that is not directly part of a particular feedback process. Descriptions of the components and key parameters governing both feedback strength and component behaviour are given in Table 1.
Social-conformity feedback
The social networks in which individuals are embedded at home, work, school or leisure have a strong influence on opinions and behaviour30,31. Social norms (that is, representations of the dominant or acceptable practices or opinions within a social group) are costly for individuals to violate and, over the long term, can shape individual identities, habits and world-views32,33. Studies in the USA have shown that perceived social consensus, that is, the degree to which individuals believe a particular opinion or action is dominant within their social group, can partially explain belief in climate change and support for climate policies34. A large body of literature has also shown that social norms are one important determinant of the probability that an individual engages in pro-environmental behaviour, such as conserving energy or adopting solar panels35,36,37. A tendency towards social conformity can lead to tipping-point-type dynamics in which a system transitions suddenly from a previously stable state given a sufficient critical mass of proponents of the alternate norm24,38. The model includes the social conformity effect in two ways: formation of public opinion regarding climate policy and individual decisions on adopting pro-climate behaviour (Fig. 1).
Climate change perception feedback
The anthropogenic influence on the Earth’s climate system is increasingly apparent39,40,41. Assessments of the contribution of anthropogenic warming to the probability of particular extreme events are increasingly routine42. It has been hypothesized that this emerging signal of climate change in people’s everyday experience of weather might lead to widespread acknowledgement of the existence of global warming and possibly, by extension, support for mitigation policy43. A large number of studies have connected stated belief in global warming with local temperature anomalies: people appear to be able to identify local warming44,45 and are more likely to report believing in climate change if the weather is (or is perceived to be) unusually warm46,47,48,49. In effect, people appear to be using their personal experience of weather as evidence informing their belief in climate change49.
However, this so-called ‘local warming effect’ is complicated50. Several papers have found evidence that interpretations of weather events are filtered through pre-existing partisan identities or ideologies45,51,52. This suggests the presence of motivated reasoning (that is, the rejection of new information that contradicts pre-existing beliefs) in the processing of climate-change-related information53,54. Moreover, the perception of weather anomalies might well be complicated by a ‘shifting-baselines’ effect in which people’s perception of normal conditions is quickly updated on the basis of recent experience of weather55.
Political interest feedback
The large-scale emissions reductions that are required to stabilize the climate system cannot be accomplished by individuals acting alone, meaning the question of how individual support or opposition to climate policy translates into collective action through the political system is critical. This process is not straightforward—it is subject to political–economic constraints operating through complex political and government institutions and cannot be modelled as a simple linear function of public opinion56,57,58. The political economy literature has documented a positive feedback effect in which initial policy change establishes powerful interests able to lobby against policy reversal and for further change, the establishment of the wind energy industry in Texas being one example26,27. Although most examples in the literature are ones of reinforcing feedback processes, Stokes27 also documents instances of balancing feedback processes—where small policy changes activate powerful incumbents to lobby against further changes that threaten their interests.
Credibility-enhancing display feedback
Although the ability of individuals to alter the trajectory of greenhouse gas emissions is limited, individual adoption of pro-environmental behaviours can have spillover effects to the larger social network. Changing behaviour to better align one’s consumption or practices with how one believes society ought to function can strengthen this moral identity and send a normative signal to other community members about desirable collective outcomes59,60. Engaging in costly personal actions aligned with collective goals can act as ‘credibility enhancing displays’, increasing the persuasiveness of the actor. Kraft-Todd et al.61 use this framework to explain why community ambassadors promoting solar panel installation were more effective if they had installed solar themselves. For climate change more generally, Attari, Krantz and Weber62,63 found that the personal carbon footprints of researchers advocating climate policy affects their credibility and the impact of their message.
Expressive force of law feedback
To the extent legal or judicial institutions are perceived as legitimate, changes in laws coming out of them can provide information about desirable or common attitudes within the population, feeding back to reinforce the attitudes or behaviour of the society that produced them. Tankard and Paluck64 identify signals from governing institutions as one of three sources of information about community norms. Legal scholars have developed the theory of the ‘expressive function’ of law—the idea that law and regulation work on society not only by punishing undesirable behaviour but also by signalling what kind of behaviour is praiseworthy and what is reprehensible65,66,67. This signal is particularly important if individuals have imperfect information about the distribution of attitudes or behaviour within a reference population67,68. Several papers have found evidence for feedback from changes in laws and regulations to the perception of social norms, attitudes or behaviour, including the legalization of gay marriage69,70, smoking bans71 and the COVID-19 lockdowns72.
Endogenous cost-reduction feedback
New energy technologies are often expensive, but also tend to exhibit price declines with installed capacity. This ‘learning-by-doing’ effect has been widely documented in the energy systems literature and is incorporated into some energy system models73. Falling costs are attributed to the combination of economies of scale, lower input costs and efficiencies in the production process and design74. This is a reinforcing feedback process, where small initial deployments, possibly driven by subsidies or regulatory requirements, lower costs and enable further deployment. Rubin et al.75 reviewed estimated learning rates (that is, the fractional reduction in cost for a doubling of installed capacity) for 11 generation technologies and found ranges between −11% and 47% with many estimates falling in the 2% to 20% range.
Temperature–emissions feedback
The effects of climate change are expected to be widely felt across geographical regions and economic sectors. These impacts themselves might well affect the capacity of the economy to produce emissions. Most notably, some work has suggested large effects of warming on economic growth76,77, which could substantially reduce the level of economic production over time with a corresponding reduction in greenhouse gas emissions. However, other effects through the impact of warming on energy demand78 or on the carbon intensity of energy production79,80 might either partially offset or exacerbate this effect. Woodard et al.8 provide a central estimate of these combined effects of a 3.1% decline in emissions per degree of warming, with upper and lower bounds ranging from −10.2% to 0.1%.
The model developed here is designed to investigate the complex, emergent behaviour of the coupled climate–social system, including the feedback processes described above. Figure 1 shows the six major model components that operate across four interconnected scales: individual (cognition component), social (opinion and adoption components), national (policy component) and global (emissions and climate components). Descriptions of processes and key parameters in each component are given in Table 1, and equations and parameters are fully documented in the Methods and the ‘Model documentation’ section of the Supplementary Information.
Tipping points, interactions and thresholds
The coupled feedback processes across model components described above can produce complex, highly nonlinear behaviour that depends sensitively on interactions across social, political and technical systems. We begin by demonstrating this behaviour through three systematic explorations of the model parameter space, designed to highlight interactions across scales and model components. These values were chosen deliberately to highlight tipping-point and threshold behaviour in the model and are not necessarily the most likely or representative values. Constraints on the distribution of parameter values are discussed in the next section. Each panel in Fig. 2 shows model output, systematically varying 2–3 parameters while keeping all of the other model parameters fixed at the values given in Extended Data Table 1.
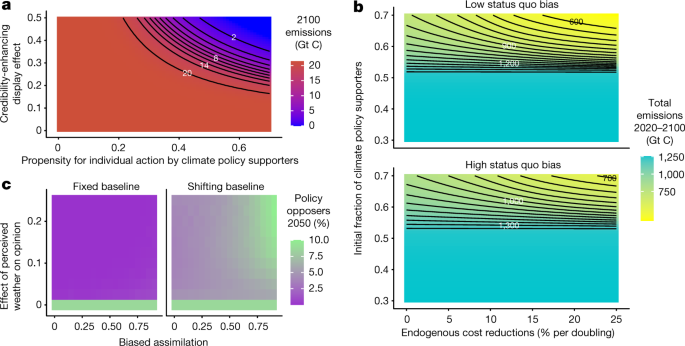
a, Illustration of a tipping point associated with individual adoption of behavioural change by climate policy supporters through the credibility-enhancing display feedback. b, The interactions between endogenous cost reductions in the energy sector and the opinion (fraction of climate policy supporters) and policy (status quo bias) components. c, The effect of the climate perception feedback and specific cognitive biases on public opinion. Model parameters that are not mentioned in each figure panel are kept constant for all of the model runs at the values shown in Extended Data Table 1.
Individual behavioural change
Figure 2a demonstrates the potential for tipping points associated with individuals’ adoption of behavioural change. The primary effect of behaviour change on emissions is small, reflecting the limited control that individuals have over how societies produce and use energy. The COVID-19 lockdowns, a global and unprecedented change in mobility and consumption patterns, temporarily reduced global CO2 emissions by somewhere between 9% and 17% (refs. 81,82), providing a possible upper bound on the effect of behavioural change on reducing carbon footprints. As emissions under our RCP7 baseline almost double by 2100, this is clearly insufficient to provide the deep decarbonization needed to stabilize global temperatures, even under universal adoption.
However, Fig. 2a demonstrates that, under some conditions, the willingness of climate policy supporters to undertake costly personal pro-climate behavioural change can be decisive in triggering positive feedback processes that tip the system into a sustainable state. This interaction operates through the credibility-enhancing display feedback from adoption to opinion; if this feedback is small or absent, then no amount of individual action can drive major emissions reduction. However, if this feedback is strong, then behavioural change by climate policy supporters persuades more people to support climate policy, an effect that triggers a cascade of positive feedback processes in the opinion (social-conformity feedback) and mitigation (learning by doing) components that drive emissions to zero by 2100.
Learning by doing
Figure 2b illustrates interaction effects between technological change in the energy system, public opinion dynamics and the responsiveness of political institutions. On average, larger endogenous cost reductions lead to larger emissions reduction. However, as this technological feedback must be initiated by climate policy, there is a threshold effect—a large nonlinear change in model behaviour at a particular parameter value—associated with the fraction of the population supporting climate policy. Below a threshold level of support, there is no policy driving the initial deployment required to kickstart the cost-reduction feedback. Moreover, even beyond this threshold, higher levels of support lead to faster deployment and a larger effect of endogenous cost reductions (indicated by the steepening of the contour lines at the top of the figure). The two panels in Fig. 2b highlight how the characteristics of political institutions affect this relationship: those that are less responsive to public opinion (that is, high status quo bias) (Fig. 2b bottom) have a higher threshold for policy support and ramp up climate policy more slowly, leading to higher cumulative emissions over the twenty-first century, even in the presence of a strong cost-reduction feedback in the energy sector.
Perception of climate change
Figure 2c illustrates how information from the climate system might influence public opinion dynamics if observation of the weather affects support for climate policy (that is, the climate perception feedback). The existence of this feedback can have a decisive influence on opinion dynamics, as illustrated by the threshold behaviour at zero. Model behaviour is substantively different even for very small effects of perceived weather on climate policy opinion compared with model behaviour with no perception effect. However, this is moderated substantially in the presence of cognitive biases that can fully offset the cognition feedback. In model runs using a fixed baseline for the perception of temperature anomalies (Fig. 2c left), the population unanimously favours climate policy, regardless of biased assimilation, because the perceived weather changes are so large.
The presence of shifting baselines (Fig. 2c right) complicates this effect. In particular, when biased assimilation is large, a stronger perception feedback leads to more climate policy opposers in 2050 compared with if that feedback were weaker or absent. This is because, if baselines shift and people compare current weather only to the past 8 years, they will periodically perceive unusually cold anomalies due to natural weather variability, even though temperatures are warm relative to a fixed, preindustrial baseline55. In the presence of biased assimilation, these perceived cold anomalies reinforce the belief of climate policy opposers in their position, leading to persistence of this opinion group.
Constraining the parameter space
The illustrations in the previous section highlight how coupled socio-politico-technical feedback processes across components and scales in the climate–social system can produce nonlinear behaviour leading to a wide range of twenty-first century emission trajectories. This complexity characterizes the space of possible climate outcomes when climate policy is modelled as an endogenous product of more fundamental social and political forces. However, identifying outcomes that are more or less likely within this range requires placing some bounds on the model parameters.
The model is a highly aggregated and abstracted representation of the coupled climate–social system, meaning that parameterization is not straightforward. We performed two exercises based on hindcasting performance to partially and probabilistically constrain the parameter space. The first exercise used the population-weighted time series of public opinion on climate change in nine OECD countries (the USA, Canada, France, Germany, Italy, Spain, the UK, Australia and Japan) between 2013 and 2020 from Pew Research Center83 and the emissions-weighted average carbon price for the same countries over the same period84 to jointly constrain nine parameters in the cognition, opinion and policy components.
The second exercise used recent estimates of the effect of Swedish carbon prices on emissions to constrain two parameters in the emissions component85. Although only a tiny fraction of global emissions, the Swedish case is important because Sweden has had the world’s highest carbon price for several decades84, enabling estimates of the effect of high and sustained carbon prices on emissions. As the model includes a single abatement cost function, this exercise implicitly assumes that the Swedish abatement costs are more widely generalizable, a potential weakness of this calibration point.
For each hindcasting exercise, relevant model components are run in a Monte Carlo mode, sampling independently from the set of possible parameter values. Model output for each run is then compared to the observed time-series and parameter combinations are weighted on the basis of the distance between model output and observed data (Methods). Differences between the unweighted and weighted parameter distributions provide an indication of the extent to which observations provide constraints on the parameter value.
Extended Data Figures 1 and 2 give the results of these exercises. Extended Data Figure 1a shows how the dynamics of public opinion provide some constraint on both the social conformity and cognition feedback. Public opinion on climate policy over the last decade suggests a population socially sorted within opinion groups (that is, slightly higher network homophily parameter) with relatively slow movement between groups (that is, low persuasive force) and a relatively small role for the individual perception of climate change in opinion formation (low evidence parameter). The exercise is less informative regarding parameters in the policy component, although there is some evidence of status quo bias in the political system.
The exercise also constrains the covariance between parameters (Extended Data Fig. 1b). For example, there is covariance between the network homophily, persuasive force and shifting baseline parameters—consistency with observed changes in OECD climate opinion over time requires that opinion groups are socially separated, movement between opinion groups is slow or cognitive biases like shifting baselines limit the role of observed climate change in driving public opinion. Extended Data Figure 2 shows the results of the second hindcasting exercise on the emissions parameters, which suggests a low value for the contemporaneous effect of policy on emissions (maximum mitigation rate), but is uninformative about the persistence of those emissions reductions (maximum mitigation time).
Future emissions pathways
We used the partially constrained parameter space to probabilistically examine emissions trajectories over the twenty-first century. We performed 100,000 runs of the model, drawing from the joint distribution of the set of hindcast parameters and sampling uniformly over an additional 11 parameters, mostly within the adoption component (with the exception of a triangular distribution for the temperature–emissions feedback based on Woodard et al.8). The model is initialized using 2020 public opinion83 and emissions data and run until 2100, with parameter values fixed for each model run. We used k-means clustering to group together model runs with similar trajectories of climate policy and emissions over the twenty-first century, identifying five distinct pathway types (Methods). A focus on clusters of similar policy and emissions pathways strikes a balance between exploring and explaining the diverse range of model behaviours while avoiding an undue focus on either the central tendency or the extremes of model outcomes.
Figure 3 shows the mean policy and emissions trajectories for the five clusters. The model parameter values characteristic to each cluster indicate the socio-politico-technical states determining each policy–emissions trajectory. These parameter values are shown visually in Extended Data Fig. 3. Table 2 describes the different pathways and gives end-of-century warming under the mean emissions scenario in each cluster.
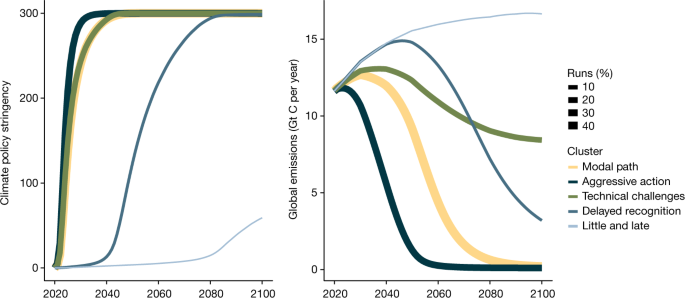
Policy (left) and global CO2 emissions (right) trajectories from 100,000 Monte Carlo runs of the coupled climate–social model, clustered into 5 clusters using k-means clustering. The line thickness corresponds to the size of the cluster.
The modal policy–emissions trajectory emerging from the model, 48% of model runs, has global emissions peaking in the 2030s and dropping steeply over the 2040–2060 period, resulting in 2100 warming of 2.3 °C above 1880–1910 levels. The 2030–2050 emissions pathway displays a perhaps remarkable similarity to recent estimates of the effect of current climate policies or stated nationally determined contributions. Sognnaes et al.11 estimate these result in fossil-fuel CO2 emissions between 30–36 Gt CO2 in 2030 and between 23–40 Gt CO2 in 2050. Assuming that fossil fuels constitute 90% of total CO2 emissions, equivalent values for the modal path trajectory are 38 Gt CO2 in 2030 and 30 Gt CO2 in 2050. This congruency arises despite the fact that current and stated climate policies are not input into the model and do not constrain model behaviour.
The second and third most frequent clusters highlight the role of feedback processes discussed above. The ‘aggressive action’ trajectory is characterized by a strong social-conformity feedback in the opinion component through a high persuasive force parameter, leading to rapid diffusion of support for climate policy that—combined with effective and globally deployed mitigation technologies—drives emissions down faster than in the modal path, limiting warming to below the 2 °C temperature target. By contrast, the ‘technical challenges’ trajectory is characterized by a weak or absent learning-by-doing cost reduction feedback within the energy sector, as well as expensive and ineffective mitigation technologies. This pathway has the same climate policy trajectory as the modal path, but the absence of the technical-change feedback driving costs down over time leads to much greater emissions and warming of 3 °C by 2100.
Two other trajectories (‘delayed recognition’ and ‘little and late’) exhibit multi-decade delays in climate policy, producing higher emissions over the century. These trajectories (which together constitute just over 5% of model runs), tend to be characterized by weak social conformity feedback in public opinion (through high network homophily and low persuasive force), cognitive biases limiting any effect of perceived climate change in increasing support for climate policy and an unresponsive political system (high status quo bias) that slows climate policy even as public support increases.
Examining the set of parameters that distinguish the clusters of policy and emissions trajectories from each other (Table 1 and Extended Data Fig. 3) reveals an important role for parameters associated with the opinion, mitigation, cognition and policy components, particularly the strength of social conformity (for example, network homophily and persuasive force), the strength of mitigation technology feedback and effectiveness (for example, learning by doing, mitigation rate and lag time), the responsiveness of political institutions (for example, status quo bias) and the role of cognitive biases (for example, shifting baselines and biased assimilation). Parameters from the adoption component notably do not tend to be distinguishing characteristics of policy and emissions pathways. Thus, although the model can exhibit tipping-point behaviour in which individual adoption of behavioural change can be decisive in driving the system towards zero emissions (Fig. 2a), the particular conditions that are necessary for this model behaviour do not appear to be common after constraining the model parameters using the hindcasting exercise.
Drivers of variance in model behaviour were further explored by fitting random-forest models to two outputs of the 100,000 Monte Carlo runs of the calibrated model: policy in 2030 and cumulative emissions over 2020–2100. Normalized values of the 22 model parameters are used as explanatory variables. Extended Data Figure 4 gives the minimum depth distributions for the most important 10 variables for each model. As with the clustering analysis, variables related to opinion dynamics (persuasive force and network homophily), responsiveness of the political system (status quo bias and political-interest feedback), individual perception of climate change (shifting baselines and evidence effect) and mitigation technologies emerge as important in explaining variation in policy and emissions trajectories over the twenty-first century.
More News
A myopia epidemic is sweeping the globe. Here’s how to stop it
Monkey business: primates’ social life tracked with wireless neuronal recording
Daily briefing: Carrion crows have counting skills seen only in people