


Under a microscope, mammalian tissues reveal their intricate and elegant architectures. But if you look at the same tissue after tumour formation, you will see bedlam. Itai Yanai, a computational biologist at New York University’s Grossman School of Medicine in New York City, is trying to find order in this chaos. “There is a particular logic to how things are arranged, and spatial transcriptomics is helping us see that,” he says.
‘Spatial transcriptomics’ is a blanket term covering more than a dozen techniques for charting genome-scale gene-expression patterns in tissue samples, developed to complement single-cell RNA-sequencing techniques. Yet these single-cell sequencing methods have a downside — they can rapidly profile the messenger RNA content (or transcriptome) of large numbers of individual cells, but generally require physical disruption of the original tissue, which sacrifices crucial information about how cells are organized and can alter them in ways that might muddy later analyses. Immunologist Ido Amit at the Weizmann Institute of Science in Rehovot, Israel, says that such experiments would sometimes leave his group questioning their results. “Is this really the in situ state, or are we just looking at something which is either not a major [factor] or even not real at all?”
By contrast, spatial transcriptomics allows researchers to study gene expression in intact samples, opening frontiers in cancer research and revealing previously inaccessible biology of otherwise well-characterized tissues. The resulting ‘atlases’ of spatial information can tell scientists which cells make up each tissue, how they are organized and how they communicate. But compiling those atlases isn’t easy, because methods for spatial transcriptomics generally represent a tension between two competing goals: broader transcriptome coverage and tighter spatial resolution. Developments in experimental and computational methods are now helping researchers to balance those aims — and improving cellular resolution in the process.
Scaling FISH
The roots of spatial transcriptomics date back to the 1960s and the development of in situ hybridization. This technique uses labelled snippets of nucleic acid as probes to detect the presence and position of complementary DNA or RNA sequences in cells or tissues. Initially, researchers used radioactive labels, but later turned to fluorescent tags that can be imaged under a microscope.
By 1998, thanks to advances in microscopy and image processing, researchers could identify individual RNA molecules in cells. Using this single-molecule fluorescence in situ hybridization (smFISH) method, it was possible to visualize individual mRNA transcripts from several genes simultaneously by using probes of different colours. But early versions of smFISH could monitor only three or four genes at a time — far short of the tens of thousands of genes expressed in the human transcriptome. “One of the fundamental limitations of microscopy is that you can’t look at that many colours or molecules at a time, even though you get this really rich spatial information,” says Fei Chen, a cell biologist at the Broad Institute of MIT and Harvard in Cambridge, Massachusetts.
Clever twists on the technique have since overcome those limits. For example, multiplexed error-robust FISH (MERFISH), reported by biophysicist Xiaowei Zhuang and her colleagues at Harvard University in 2015, can detect and discriminate between thousands of mRNA transcripts from different genes using just a few fluorescent tags1. Each transcript is assigned a unique binary barcode made up of ones and zeroes, and then labelled with multiple complementary ‘encoding probes’ that contain read-out sequences. Samples then go through sequential rounds of hybridization and imaging with various fluorescently labelled ‘read-out probes’ to decipher this barcode.
When a read-out probe binds to the read-out sequence of an encoding probe and gives off a fluorescent signal, it is read as a ‘1’; if there is no fluorescence, it is read as a ‘0’. Multiple rounds of imaging yield a binary barcode that can identify the detected RNA. The ‘error-robust’ part of the technique refers to the barcodes’ design: they are sufficiently different from one other that there is little chance of misinterpreting which mRNA sequence is being detected.
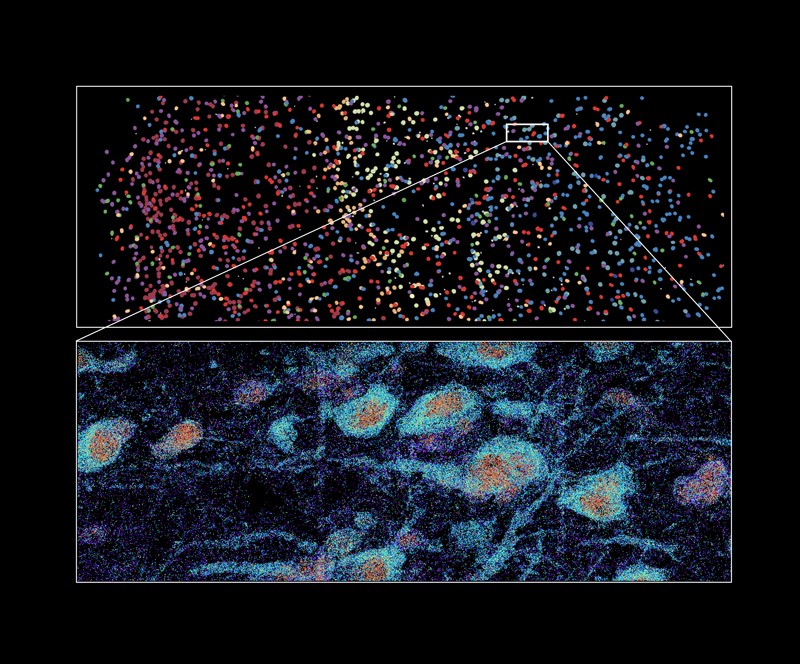
MERFISH imaging of part of the human brain, showing cell types labelled with various colours (top) and labelled RNA molecules from different genes in individual cells (bottom).Credit: Xiaowei Zhuang Lab, Harvard University and HHMI
Although the method was initially described as a tool for single-cell analysis, Zhuang’s team also applies it to tissues, including the human brain2. “By profiling the expression of 4,000 genes, we were able to generate a molecularly defined and spatially resolved cell atlas of the human cortex at an unprecedented molecular and spatial resolution,” she says. This analysis, which is in the press in Science, established the identity and location of more than 100 distinct cell subtypes, and revealed striking differences in the cellular composition and organization of cortical brain structures in humans relative to mice. In earlier work, Zhuang’s group has also used the technique to chart parts of the mouse brain, including the motor cortex and the hypothalamus.
Other barcoding and imaging methods provide similar benefits. For example, spatially resolved transcript amplicon read-out mapping (STARmap), described by a team at Stanford University in California in 2018, uses a form of in situ sequencing to detect mRNA transcripts in intact tissue samples3. Exploiting a set of gene-specific barcodes, each made up of 5 nucleotides, the Stanford team mapped and quantified more than 1,000 gene transcripts in mouse brain tissue with single-cell resolution.
But imaging-based methods also have drawbacks. For example, as these approaches grow to encompass more targets, they become ever more labour-intensive. MERFISH can detect more than 10,000 genes at a time, but experiments at this scale generally need an extra step — a ‘tissue-expansion protocol’ to swell the volume of each sample so that microscopy can successfully resolve different molecules. Another method, seqFISH+, overcomes this limitation by using a more complex colour-coding strategy4. But seqFISH+ requires many more rounds of labelling and imaging — 80, as opposed to 23 for MERFISH — for the same number of genes. And both methods require more than a day of uninterrupted microscopy time to collect data at the transcriptome scale.
An array of alternatives
Perhaps the most fundamental limitation of hybridization-based techniques is that researchers must decide in advance which genes they wish to target. “Once you start to select markers, you are going to lose information,” says Amit. Array-based methods offer a broader view of the transcriptome but at a cost — they have lower sensitivity and reduced spatial resolution.
Joakim Lundeberg, a molecular geneticist at the KTH Royal Institute of Technology in Stockholm, who is one of the pioneers of spatial transcriptomics, described such an approach in 20165. He and his colleagues dotted a glass slide with an ordered array of oligonucleotides designed to capture mRNA strands. These work by binding to the long tail of adenine nucleotides that terminates each mRNA transcript. After applying a thin slice of tissue to the top of the slide, the researchers treated the tissue with chemicals that made it permeable, allowing the RNA to leak out and bind to the array. The captured RNA was then converted into DNA, and sequenced. Because each oligonucleotide contains a distinctive barcode that denotes its position on the slide, the final data reveal not only the identity of the mRNA, but also its location in the tissue. The resulting data can then be visualized as a pixelated map overlaid on a microscopic image, in which each pixel reveals which genes were expressed at each position.
Lundeberg’s team has used this technique to sample the full transcriptomes of brain and tumour tissue samples, albeit with limited spatial resolution. In the original method, the pixels described spots roughly 100 micrometres in diameter — 10 times wider than a typical cell. Since then, the technique has been commercialized by the firm 10x Genomics in Pleasanton, California, as the Visium Spatial Gene Expression platform, with a spot size of 55 µm. Yanai’s team has used the platform to map the architecture of pancreatic and skin tumours. And even without single-cell resolution, they have gained valuable insights about tumour architecture and biologically important interactions between cancer cells, healthy host tissue and immune cell populations, he says.
The past few years have seen a flurry of effort to sharpen the resolution of array-based methods. Chen and his collaborator Evan Macosko at the Broad Institute, for instance, developed a method6 called Slide-seq, which has a resolution of 10 µm — about the size of a single cell, Chen says. And 10x Genomics has announced that its next-generation Visium HD platform, due to be released later this year, will also provide single-cell resolution, although no data have so far been published.
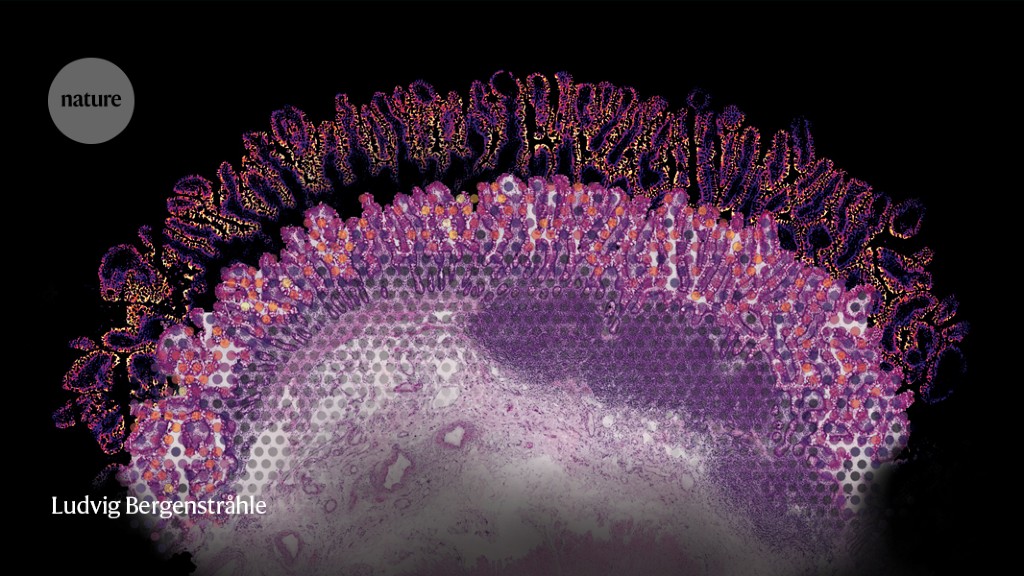
A combined image showing tissue structure, RNA data and super-resolved gene-expression maps of cells in the mouse olfactory bulb.Credit: Ludvig Bergenstråhle
In May, researchers at the life-sciences company BGI-Shenzhen in Shenzhen, China, described an array-based method that cracks the single-cell barrier7. Called Stereo-seq, it uses patterned arrays of barcoded DNA nanoballs that are roughly 200 nanometres in diameter and a few hundred nanometres apart. “We actually have something like 400 data spots to generate one cell,” says Xun Xu, executive director of the BGI Group and one of the method’s developers. It can be applied to large samples, including an entire macaque brain that was cut into slices measuring three by five centimetres, as reported in a preprint this year8. Sequencing alone took nearly two months, says Ao Chen at BGI-Shenzhen, who is also part of the Stereo-seq team.
But as resolution tightens, so too do the technical challenges. One is diffusion: as mRNAs leak out of the tissue, they can spread laterally before encountering a capture probe, distorting the data. Lundeberg says that by optimizing the extent of tissue permeabilization, researchers can limit this diffusion to a few micrometres, which is more than sufficient for cellular resolution. “If you really would like to see the subcellular resolution, you should go for the imaging-based platforms instead,” he suggests.
Another challenge is one of physics: as pixel size decreases, so does the number of probes available to capture mRNA. Lundeberg says that he abandoned a high-resolution version of his group’s platform because it lacked the sensitivity to capture biologically relevant mRNA signals. The BGI team reports that Stereo-seq can typically detect 300–500 genes per cell, which offers a useful — but limited — view of gene-expression activity. Even so, the team has used the method to construct 3D atlases that chart the spatial shifts in gene expression that accompany embryonic development in mice7, flies9 and zebrafish10.
Reading between the lines
Making sense of spatial data requires dedicated computational tools. For example, researchers might need to deduce which cell types are present using data that samples only a subset of the transcriptome. Many researchers achieve this through parallel analysis of single-cell RNA-sequencing data collected from the same tissue. “Then you can match and align what you’re seeing on the spatial data with what you’re seeing in the single-cell data,” says Fei Chen. This comparison allows researchers to position cell types inferred from RNA sequencing data sets onto spatial transcriptomic maps.
Some algorithms can even work out the cellular composition of the relatively large pixels produced by platforms such as Visium, which can contain multiple cells. Fei Chen and Harvard-based computational biologist Rafael Irizarry developed an open-source algorithm called robust cell-type decomposition (RCTD) for this separation process, also known as spot deconvolution11. RCTD is broadly applicable to most array-based methods, Fei Chen says. It not only identifies which cells are present at a given pixel, but also fleshes out missing details about those cells’ gene-expression activity. RCTD can be applied to imaging-based methods such as MERFISH for segmentation, Fei Chen adds — identifying cellular boundaries from gene-expression data derived from single-cell RNA sequencing.
Imaging data can also be a powerful asset for cellular deconvolution, and most array-based spatial transcriptomics techniques can capture such data in parallel, says Mingyao Li, a geneticist and statistician at the University of Pennsylvania in Philadelphia. “You can zoom in, you can look at the tissue-specific features, how many cells there are, what is the cell density, and what are the morphological features of individual cells,” she says. But tying these elements together is a challenging and data-intensive task, often requiring sophisticated computational approaches.
For instance, Lundeberg and colleagues published a study12 in which they trained a deep-learning algorithm with transcriptomic and histological data from a Visium instrument to extrapolate details well outside the contents of individual spots. “We could predict very accurately the gene expression between spots,” he says, referring to the physical gaps that are inherent to every array-based method. “We could actually infer the single-cell resolution from that.”
Identifying cell types is just the beginning, however. Different cell types might have strikingly distinct phenotypes depending on where they are located in a tissue, and these patterns of differential gene expression can make a spatial cellular atlas much more powerful. Machine-learning algorithms are useful for teasing out this variability, too. For example, Amit and colleagues developed a tool called DestVI that both resolves which cells are located at each array spot and captures distinctive biological states in various cell types13. Using it, the team identified immune-cell phenotypes in cancerous tissues. “One can get to a much higher-level understanding of the physiology or pathology in a tissue,” says Amit.
Bringing it all together
Perhaps surprisingly for a field that produces so much data, what spatial transcriptomics researchers need now are more data. Initiatives such as the Human Cell Atlas, which has released transcriptomic data collected from millions of cells from 33 organs (www.humancellatlas.org), are particularly valuable. Such high-quality, standardized data could be used to train analytical algorithms, for example.
Spatial transcriptomics has yet to reach the level of collaboration and data-sharing seen in more established fields such as genomics or single-cell transcriptomics, and this can be a source of frustration. In many cases, Fei Chen says, laboratories will share only the minimum required by publishers and funders — the raw, unprocessed data from an experiment — meaning it could take months to reproduce the work. But there have been promising developments. Following the publication of its Stereo-seq work, for instance, the BGI Group launched the Spatio Temporal Omics Consortium, which has already drawn more than 80 researchers from around the world. Its goal is to use various spatial methods to tackle tough questions in areas related to human physiology, pathogenesis and evolutionary biology.
In the meantime, researchers are looking to further enhance the technology. For example, Lundeberg’s team is using spatial transcriptomics to infer genomic changes that occur during prostate tumour development — insights that would normally be accessible only from genome sequencing of isolated cells. “Within a single tissue section, you see these extremely early events that no one has looked for,” he says, adding that many of these changes are occurring in cells that otherwise seem benign.
As for Yanai, he’s enthusiastic about the opportunity to eavesdrop on how adjacent cells communicate with and influence one another. Such crosstalk is an essential component of normal organ formation and development, and could help to reveal the organizational principles of tumour tissue. “The cancer cells are manipulating the non-cancer cells,” says Yanai. Spatial transcriptomics could capture that manipulation as it happens. “It’s like this missing piece of the puzzle,” he says.
More News
Author Correction: Bitter taste receptor activation by cholesterol and an intracellular tastant – Nature
Audio long read: How does ChatGPT ‘think’? Psychology and neuroscience crack open AI large language models
Ozempic keeps wowing: trial data show benefits for kidney disease