


Lockdowns, early and late
The dots in this graph show the levels of infection at which governments introduced stay-at-home lockdowns during the COVID-19 pandemic. Countries that aimed for elimination early on, such as Australia and China, became more cautious with time and ordered lockdowns at progressively lower levels of cases. In many other countries, governments became less likely to take early action and tolerated higher case numbers in subsequent waves before they ordered lockdowns. Our Feature discusses what scientists have learnt from COVID-19 lockdowns.
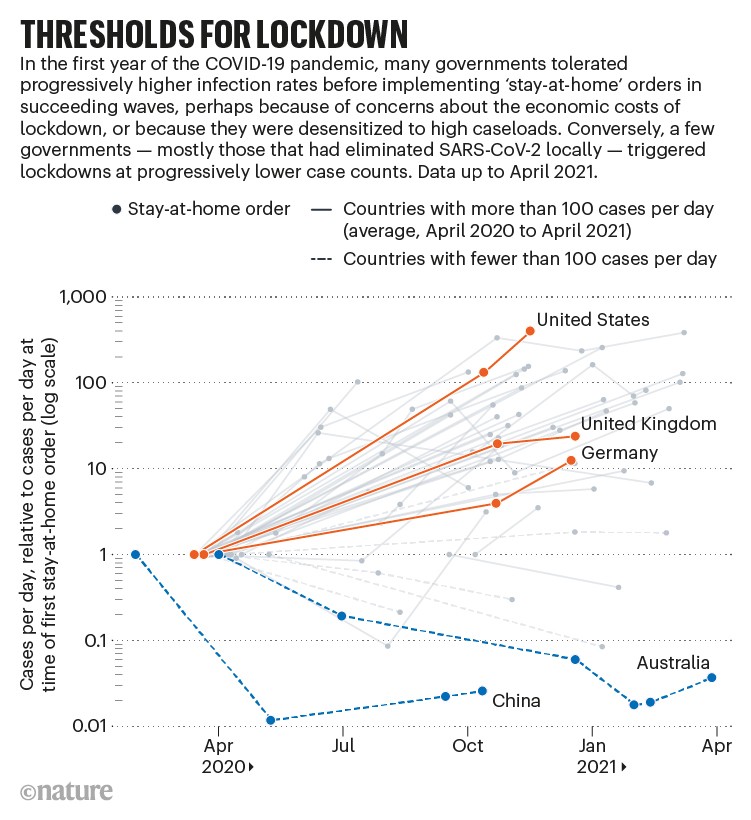
Source: T. Phillips et al. Interface Focus 11, 20210041 (2021).
What worked against COVID-19
This graphic represents one effort to assess which lockdown measures were most effective at combating COVID-19 by reducing R, the average number of people one person with SARS-CoV-2 goes on to infect. A dot that lies towards the left indicates a more effective measure, and the various colours represent different statistical tests for analysing effectiveness. The most successful policies were those that banned small gatherings or closed businesses and schools, closely followed by land-border restrictions and national lockdowns. Less-intrusive measures — such as government support for vulnerable populations, and risk-communication strategies — also had an impact.
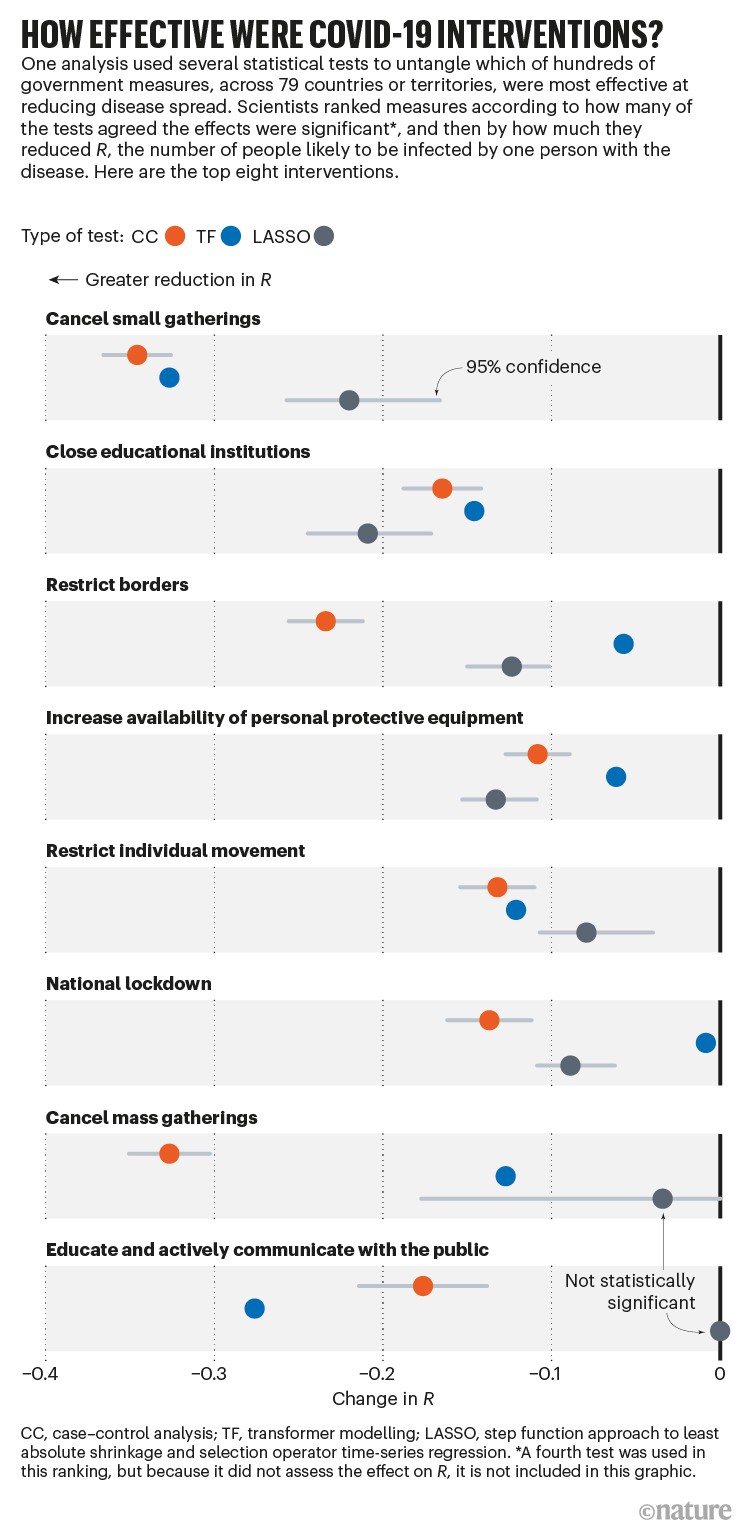
Source: N. Haug et al. Nature Hum. Behav. 4, 1303–1312 (2020).
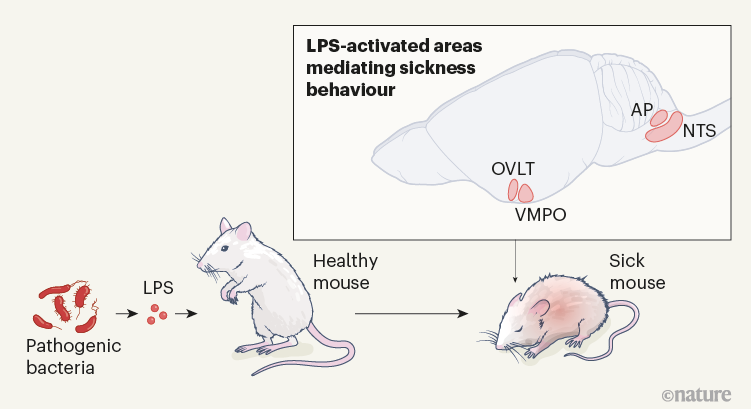
Sick-day neurons
Infections in animals and humans trigger a set of ‘sickness behaviours’, including chills, fever, loss of appetite and lethargy — all responses that help the body to cope with a disease. Researchers have identified a specialized population of neurons in the brain that orchestrate these behaviours in mice — as this graphic shows. They injected mice with a molecule called lipopolysaccharide (LPS), which is found in bacteria and is widely used to mimic bacterial infections. The researchers showed that neurons in certain brainstem regions — called the area postrema (AP) and the nucleus tractus solitarius (NTS) — are activated by LPS and are involved in driving sickness behaviours. Another recent study also implicated part of the brain’s hypothalamus — the organum vasculosum of the lamina terminalis (OVLT) and the ventral medial preoptic area (VMPO). One open question is whether the same neuronal circuits are involved in prolonged, chronic symptoms of viral infections, such as long COVID.
More News
Editorial Expression of Concern: Leptin stimulates fatty-acid oxidation by activating AMP-activated protein kinase – Nature
Quantum control of a cat qubit with bit-flip times exceeding ten seconds – Nature
Venus water loss is dominated by HCO+ dissociative recombination – Nature