


Modern history of spillovers
This chart shows the viral diseases that have spilled over from animals to humans since 1918, and how many people were killed by the resulting outbreaks. Spillover events have probably triggered every viral pandemic that’s occurred since the start of the twentieth century. The probability of future pandemics could be increasing, largely because of the way that people are changing the environment. The authors of a Comment article argue that the likelihood of spillover could be greatly reduced with investment to cut global deforestation in hotspots for emerging infectious diseases; curtail and regulate trade in wildlife; and improve the ability to detect and control infectious diseases in farmed animals. The cost of around US$20 billion per year, they say, is small compared with the lives lost and trillions of dollars spent in the current pandemic.
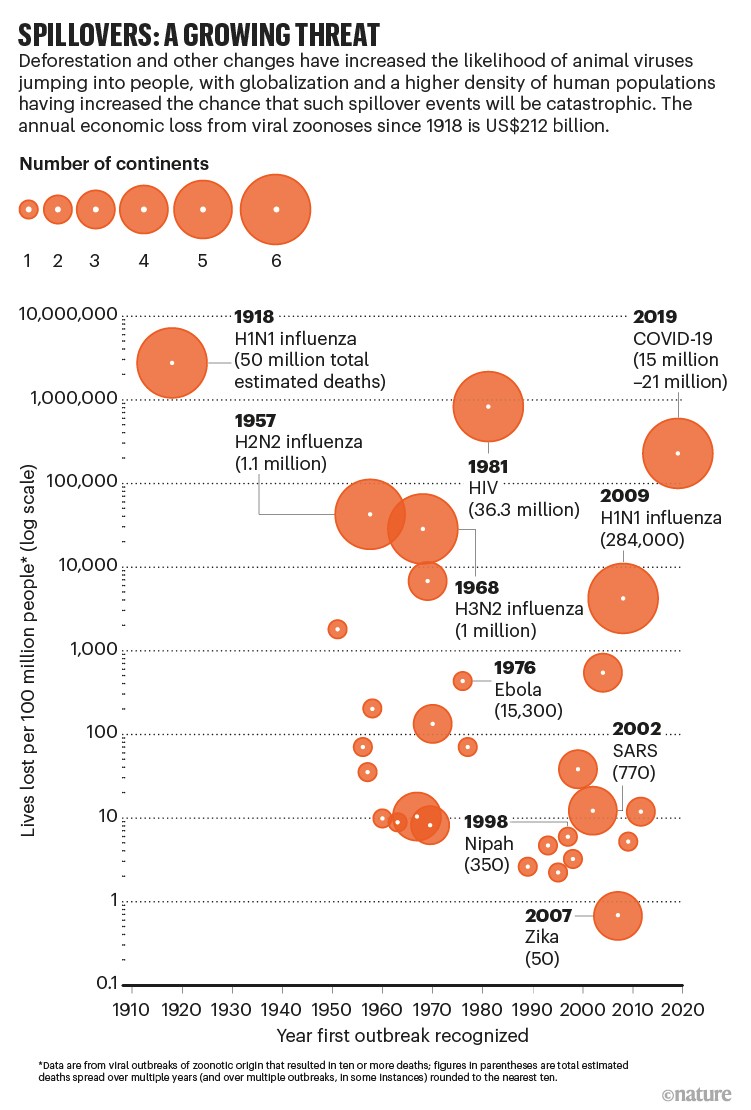
Source: A. S. Bernstein et al. Sci. Adv. 8, eabl4183 (2022).
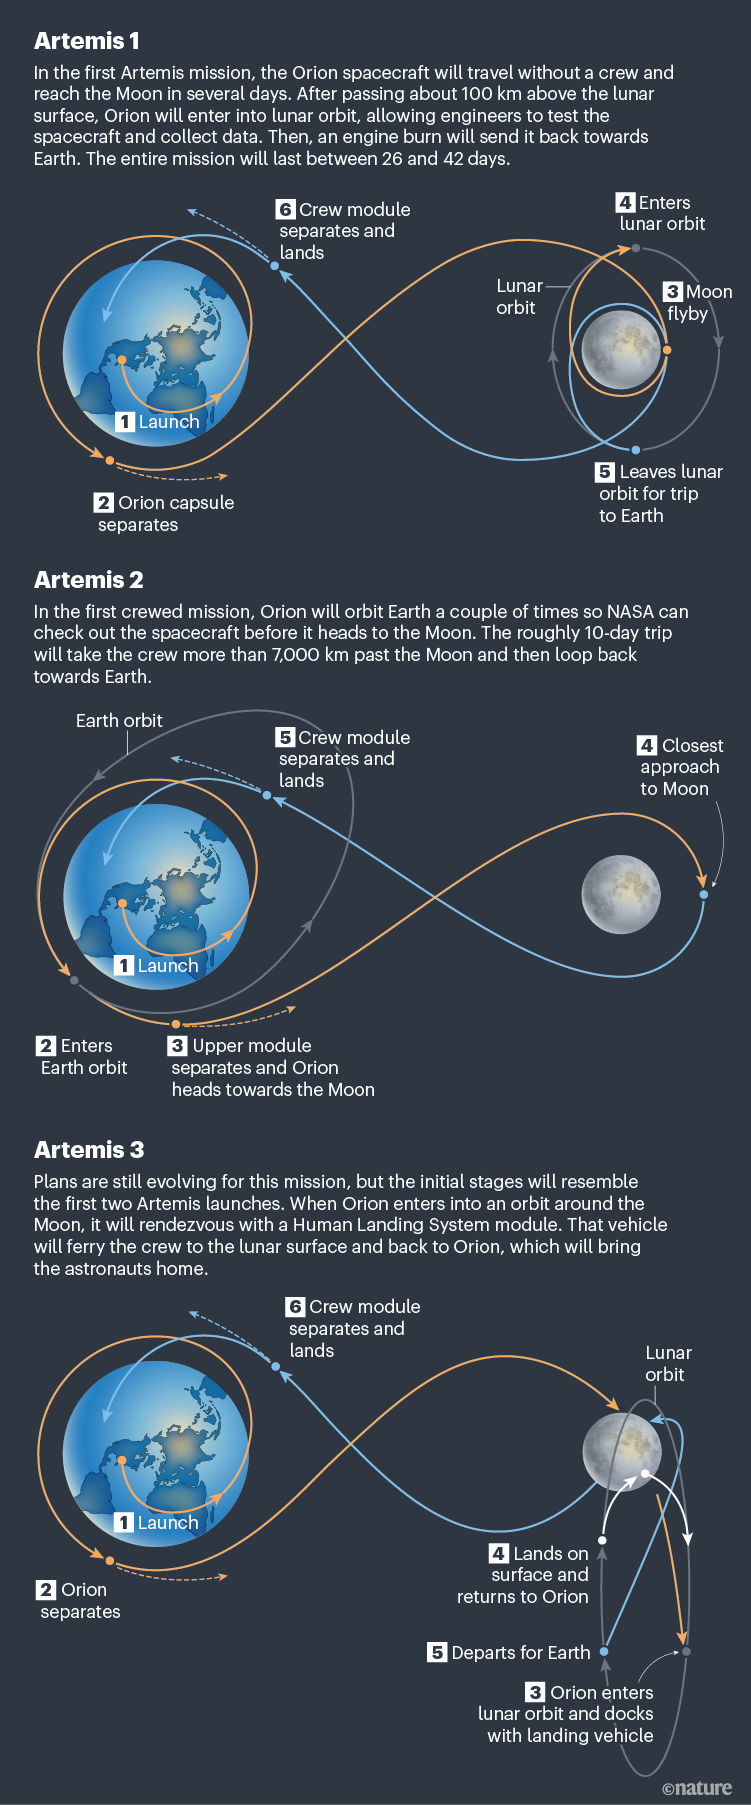
Destination Moon
More than 50 years since US astronauts last walked on the moon during the Apollo programme, NASA plans to send crews back to the lunar surface. This graphic shows the flight paths for the series of planned missions, called Artemis, after Apollo’s twin sister in Greek mythology. The first mission, Artemis 1, will fly around the Moon this year. The crew will make use of the Space Launch System — the most powerful rocket ever built and nearly 100 metres tall. This and other fantastic graphics illustrate the US$93-billion plan to put astronauts back on the Moon.
Drugs taking the fast route
This graphic illustrates how many treatments are being approved by the US Food and Drug Administration’s accelerated-approval programme. The FDA created the fast-track pathway in 1992 to get urgently needed drugs to the market without delay. Instead of demonstrating efficacy through clinically meaningful endpoints, such as patient survival or reduction of symptoms, drug candidates reviewed under this pathway often rely on what are known as surrogate endpoints, which may be faster or easier to track. For example, tumour shrinkage is a common surrogate used in clinical trials of cancer drugs, but this metric does not necessarily translate into meaningful benefits for patients. Our News story explains some researchers’ concerns that the process is being used too often by the pharmaceutical industry to speed approvals.
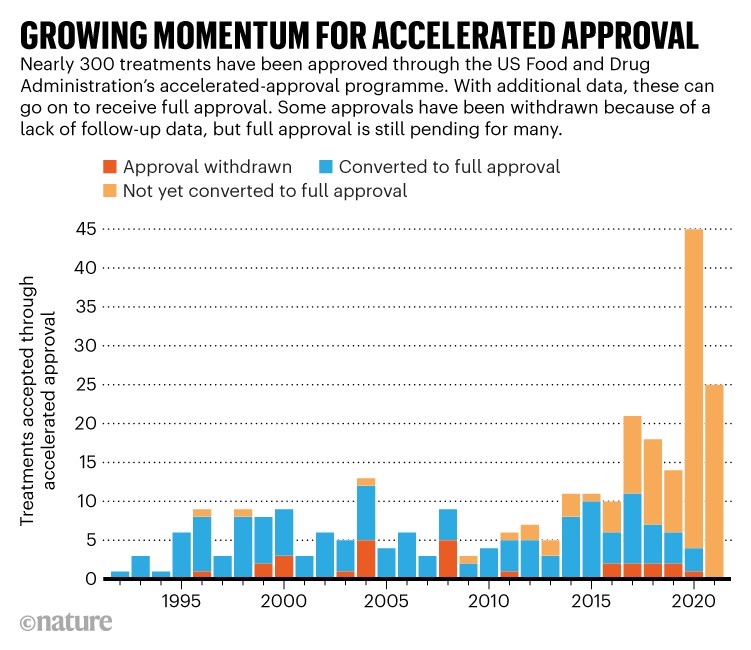
Source: FDA
More News
Daily briefing: Why exercise is good for us
Daily briefing: Orangutan is first wild animal seen using medicinal plant
Old electric-vehicle batteries can find new purpose — on the grid