


It is all about perspective
The problem stems from how people perceive the boundaries of the track forecast cone.
In general, people perceive areas that are highlighted within the cone as “at risk” and areas that are outside of the cone as being “safe.” Researchers refer to this perceived notion as the “containment effect.”
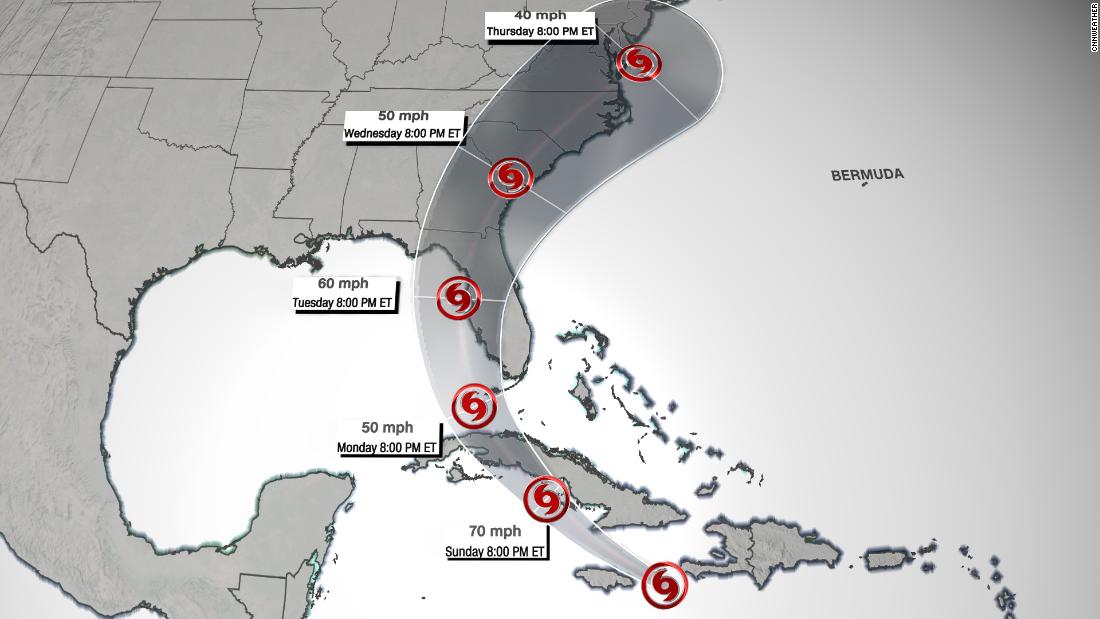
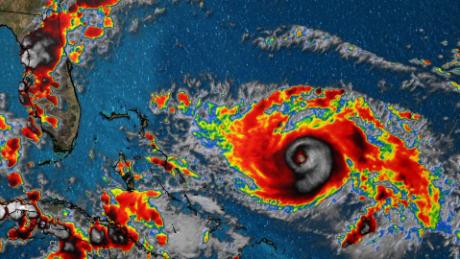
The intended message of the track forecast cone is to show where the center of the storm could be over the next five days. Statistically speaking, the longer the forecast period, the more room for error exist. The cone is much wider five days out than just 24 hours out to account for this error.
If the cone does not change significantly, then the containment effect does not play as much of a role.
But weather forecasting is not a perfect science.
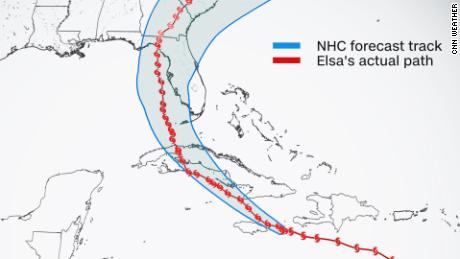
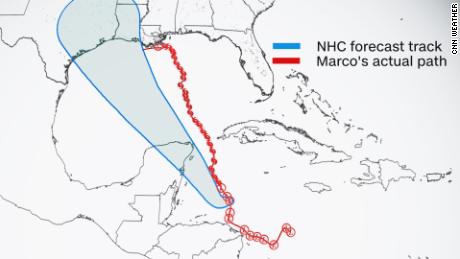
“The cone is just a shape defined by track forecast errors over the previous five years, such that there’s historically a two-thirds chance the track of the center of the storm will remain inside the cone, and a one-third chance it will be outside the cone,” McNoldy said. “The same cone is used all year long, for every forecast of every storm … they’re identical.”
However, tropical storms and hurricanes are not all identical, so this thought process could pose a problem when it comes time for hurricane preparations and evacuations.
That means if you based your hurricane preparedness plans solely off the assumption that only people inside the cone need to worry, you may not have been ready for this particular storm.
So how can this be fixed?
Enter the new tool designed by researchers at CSU. It is a series of moving dots, called “zoomies,” rather than a static image of a cone, and it seems to be more effective.
The premise of this new tool is based on the concept called ensemble perception, which is your visual system’s ability to look at a group of objects and extract a lot of information about the group.
For example, Jessica Kitt, one of the lead researchers on the CSU project, says “if you watch a herd of animals running or a school of fish you can tell not just what direction the group is heading, but also have a sense of whether they are getting closer together or spreading apart.”
“We wanted to create a tool that might enable ordinary people to better grasp what might unfold,” Kitt said. “To do that we are creating a way to tap into an aspect of the visual system. Our visual world requires us to perceive and use uncertainty, and so the visual system is inherently equipped to interpret those types of information. Leveraging these capabilities with the right visualization might help people understand the forecast and make better decisions.”
The study participants were from the University of West Florida (where hurricanes are common), as well as Colorado State University (where hurricanes are not common). For the students from CSU it also means they are largely free of biases that might arise from previous personal experiences with hurricanes.
The responses were nearly identical from both universities, suggesting that even people with personal experience of hurricanes extract the same types of information from these ensembles.
“Participants in our study see a series of hurricane forecasts, and for each forecast they are shown the position of a town in different places relative to the path of the storm,” Kitt said. “The town might be located directly in the central (most likely) path of the storm or off to the side.”
The study found that participants chose to evacuate the towns located within the cone at high rates, and the towns outside the cone at low rates. The difference between the two was very steep and happened over a very short geographical distance, basically defined by the boundary of the forecast cone itself.
But when the zoomies were added, evacuation rates focused more on the town’s location near the center of the storm’s projected path rather than simply whether the town was inside the forecast cone.
Another inherent problem with the traditional cone is that it doesn’t give you any indication of which location will have the highest rainfall, the biggest storm surge, or the best chance for tornadoes. For those you need additional information found on other forecast graphics.
But Kitt and her research colleague, psychology professor Dr. Benjamin Clegg, think their zoomies map can help with that too.
“The zoomies offer substantial flexibility with respect to their design,” Kitt says. “For example, we can use color, size, and flickering to indicate various risks such as extreme wind speeds, rainfall, or storm surge, and those can be perceived within the ensemble.”
“The cone graphics try to be everything to everyone, and the end result is a complicated graphic that might not necessarily meet its goals,” McNoldy says. “Although all of its components are described on the graphic itself, people don’t always read legends or descriptive text.”
The Hurakan Project, developed by the University of Miami, has an interdisciplinary team looking at a wide variety of concerns with the cone and innovative ways to make it better.
“Importantly, impacts from hurricanes extend for hundreds of miles away from the center, so destructive impacts will not be limited to the cone even for a perfect down-the-middle forecast,” McNoldy said.
In other words, people do not want to waste valuable time and money preparing for a storm that they do not need to because they may need that money and time later in the season when another storm arrives. For many families, the luxury of infinite financial means to prepare and evacuate is just not a reality.
However, CSU is not looking to get rid of the official forecast cone entirely.
“We also found that you can overlay the zoomies on top of the cone, and people understand the forecast better,” Kitt says. “In fact, if they have practice with this, they do a better job of interpreting the NHC cone after this experience than if they did not see the zoomies paired with the cone. So a simple switch for meteorologists might be to show zoomies with the cone.”
More News
Hillary Clinton Has Some Tough Words for Democrats, and for Women
Ukraine Steps Up Attacks With U.S. Long-Range Missiles
Video: U.Va. Faculty Calls for Review of Police Response to Protests