


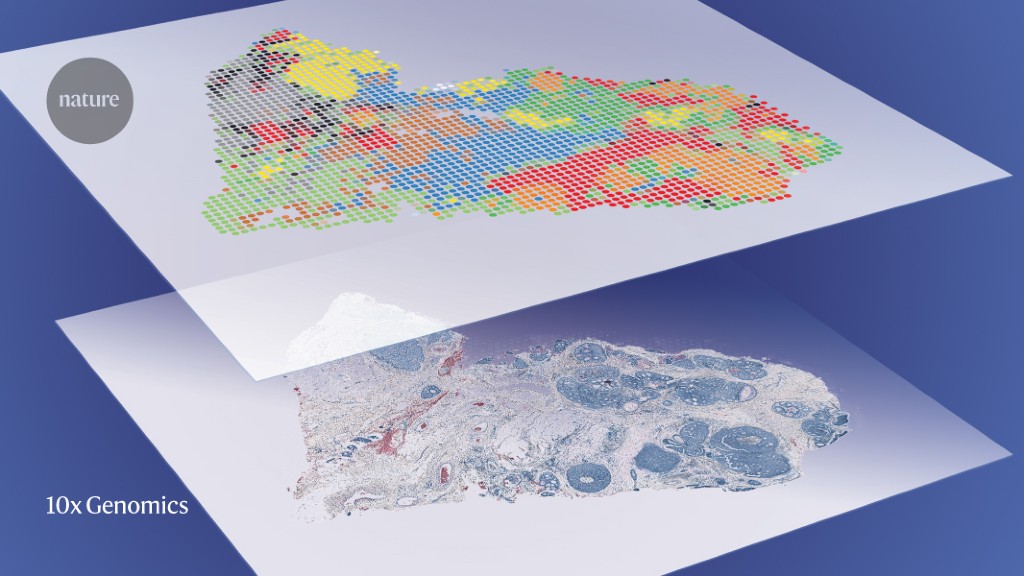
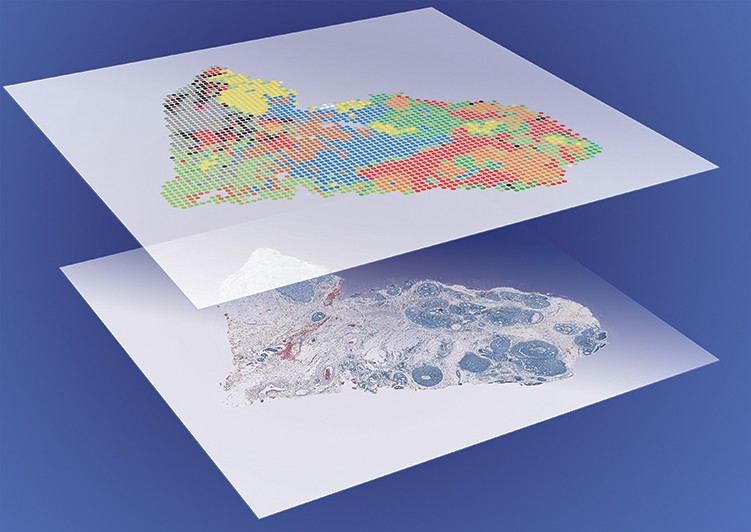
Single-cell data (top) increasingly are being combined with spatial information (bottom).Credit: 10x Genomics
It takes about 20 days for a mouse to grow from fertilized egg to newborn pup. Ricard Argelaguet and his colleagues were interested in what exactly happens inside the cells of a mouse embryo between days 4.5 and 7.5, when the stem cells shift into three layers: the ectoderm, which develops into the nervous system; the mesoderm, which develops into muscle and bone; and the endoderm, which develops into the gut and internal organs.
Researchers can easily distinguish between these three layers by looking at which genes are expressed in individual cells. But the team wanted a more nuanced picture. So, in 2019, the researchers combined the gene-expression data with two other sources of information1. The first was methylation, a chemical modification that alters how genes are expressed. The second was chromatin accessibility: how modifications to chromatin, the knotty complex of proteins and DNA in eukaryotic nuclei, affect which parts of the DNA are accessible for transcription into RNA. Both are factors in epigenetics, the non-genetic elements that influence how genes are expressed.
Combining the three data sources revealed something unexpected: in the absence of external stimuli, embryonic stem cells will become ectoderm. “This was the most essential contribution of the paper,” Argelaguet says. It showed “that there is kind of a hierarchy of cell fate specification at the epigenetic level”. Argelaguet, a computational biologist at the Babraham Institute in Cambridge, UK, was one of four first authors on the study, which was supervised by Babraham investigator Wolf Reik, as well as John Marioni at the EMBL-European Bioinformatics Institute in nearby Hinxton, and Oliver Stegle at the German Cancer Research Center in Heidelberg.
Their result explains the decades-old observation that embryonic stem cells in culture will preferentially differentiate into neurons. And it’s a finding, says Argelaguet, that would have been impossible to make using just a single type of data.
Genomics explosion
The past decade has witnessed an explosion in single-cell genomics. Single-cell RNA sequencing (RNA-seq), which profiles gene expression, is the most common technique. Other methods detail processes such as methylation, genetic variation, protein abundance and chromatin accessibility.
Now, researchers are increasingly combining these methods — and the resulting layers of data — in ‘multiomics’ experiments. Argelaguet, for instance, combined gene-expression profiling, methylation and chromatin accessibility in a technique called scNMT-seq. Another technique, CITE-seq, profiles both transcription and protein abundance. And G&T-seq captures both genomic DNA and RNA.
Whatever the acronym, all these techniques aim to glean complex biological insights that might be undetectable using any single method. But the task is computationally challenging, and making sense of the resulting data even more so. A fast-growing suite of software tools can help.
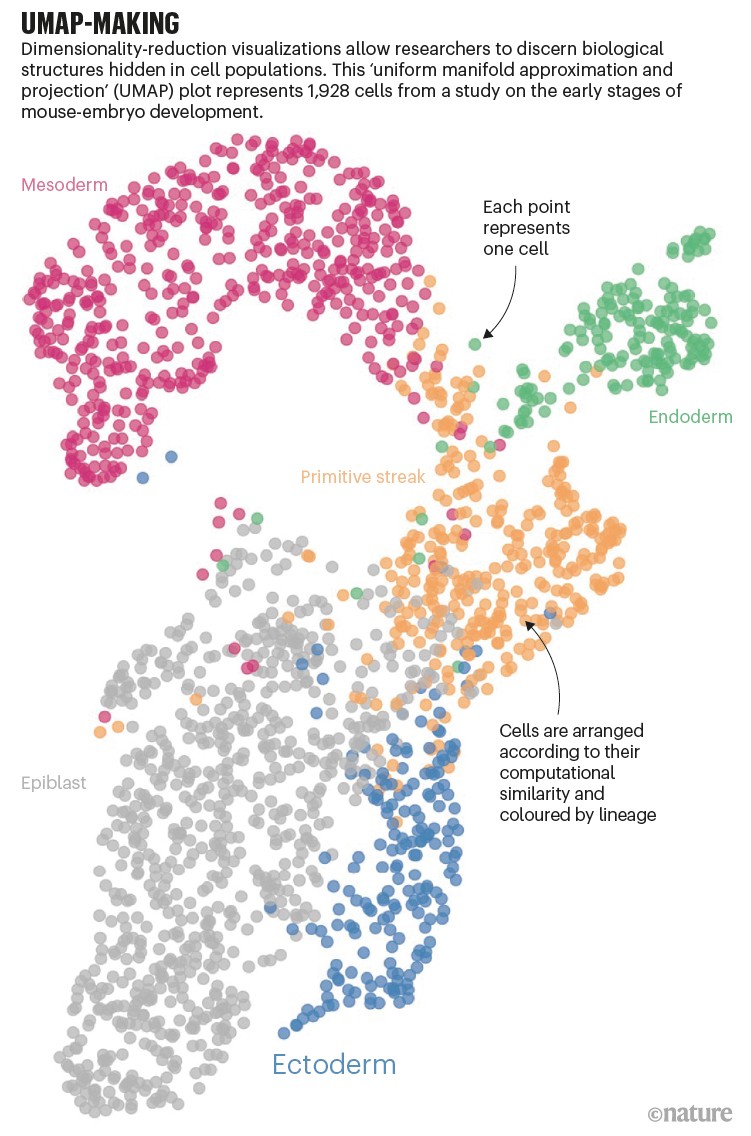
Almost all single-cell studies contain visualizations — sometimes called t-SNE or UMAP plots — which represent single cells as points on a 2D plane (see ‘UMAP-making’). Studying how those points aggregate, or cluster, can help researchers to discern biological structures. But the visualizations aren’t easy to create.
For one thing, single-cell data sets have quickly become enormous. Back in 2019, Argelaguet captured individual cells in microtitre plates using a fluorescence-activated cell sorter, which limited him to analysing 200–300 cells per week1. Now, he can process thousands of cells, thanks in part to a microfluidics platform developed by the biotechnology company 10x Genomics in Pleasanton, California. And a 2020 atlas of human fetal gene expression supervised by genome scientists Cole Trapnell and Jay Shendure at the University of Washington, Seattle, included four million cells2. The result is basically a table with 80 billion entries — 4 million rows of cells by 20,000 genes.
And yet, “the overwhelming majority of the entries in that matrix are zero”, Trapnell says. This represents a key statistical and computational challenge, as scientists work to distinguish true zeroes — for instance, genes that are actually not expressed — from dropouts that result from sample handling or sensitivity issues. One option is to use imputation methods, which ‘borrow’ data from similar cells in the data set to fill in the gaps. As Stegle puts it: “Your neighbours tell you something about the unknown.”
Difficulty squared
Combining modalities only multiplies the difficulty, says Argelaguet. “All the weaknesses, all the noise, all the challenges from each technology, it just gets exacerbated by combining them into a multimodal assay.”
Argelaguet and his colleagues spent three months collecting their data set, and two years analysing it. Jason Buenrostro, an epigeneticist at Harvard University in Cambridge, Massachusetts, says that some of his team’s computations for a study describing a method called SHARE-seq took weeks to complete3.
The pay-off of the added detail, says Bernd Bodenmiller, who studies single-cell tumour biology at the University of Zurich, Switzerland, is that it helps researchers to “understand the biology”. And they can do so using existing data sets, such as the Human Cell Atlas and its 13.5 million cell profiles. In a preprint4 published in June, Chengxiang Qiu, a graduate student in Shendure’s lab, and his colleagues combined 1.4 million cells from 4 published atlases to tease apart how one cell type arises from another across 10 days of mouse development. The resulting “trajectories of mammalian embryogenesis” revealed more than 500 transcription factors that could have a role in cell-type specification.
Software tools
The information can be integrated in three main ways, depending on what features (or ‘anchors’) the data sets have in common, says Marioni, who has published a review5 on the topic. ‘Horizontal integration’ is used for data sets of the same type — two RNA-seq data sets, for instance. In that case, genes act as the anchors, “because you’re measuring the same set of genes in every population of cells”, Marioni says.
‘Vertical integration’ involves data sets collected from the same cells, such as for RNA-seq and chromatin accessibility. And ‘diagonal integration’ involves molecular measurements made across unrelated populations of cells. “The question is, what’s the common feature that you’re going to use?” Marioni says. One approach to vertical integration is to associate sites of chromatin accessibility with the genes they regulate, and then compute a probable gene-expression profile from the data.
“So, basically, you’re making it into a horizontal-integration problem, where genes become the anchors again,” Marioni says.
Integrating data sets, Trapnell says, is like aligning DNA sequences. “You’re assuming that a population of cells that you can see with one modality is visible with the other, and that for most cells or cell populations, there’s going to be a one-to-one mapping.” The trick, he says, is to align the sets so that you can be confident that any differences you see “are not due to your inability to find the similarities. And that’s the same spirit that motivates most sequence-alignment algorithms.”
Dozens of tools have been developed to achieve this, and many are indexed on the community-driven ‘awesome-multi-omics’ and ‘awesome-single-cell’ lists on GitHub.
Seurat, for instance, developed by Rahul Satija’s team at the New York Genome Center, effectively aligns UMAP visualizations of two data sets to create a “shared, low-dimensional” space, says Tim Stuart, a computational biologist in Satija’s group. “That enables you to find neighbours of one data set in the other data set, and vice versa.” Other popular options include: Argelaguet’s MOFA, which he describes as a “kind of a multiomics generalization” of principal-component analysis; Harmony, from Soumya Raychaudhuri’s team at Harvard Medical School in Boston, Massachusetts; and LIGER, developed by Joshua Welch’s team at the University of Michigan in Ann Arbor. According to Welch, just as online retailers can mine their customers’ purchase histories to identify products that a user is likely to want, LIGER uses ‘integrative non-negative matrix factorization’ to identify related cells and cell clusters.
Spatial hackathon
With such a fast-growing tool set, researchers can struggle to know what they should use for which questions, and how to go about it. To help close those gaps, Elana Fertig at Johns Hopkins University in Baltimore, Maryland; Aedin Culhane at Harvard T. H. Chan School of Public Health in Boston; and Kim-Anh Lê Cao at the University of Melbourne, Australia, organized a virtual conference on single-cell omics data integration. As part of that event, held in June 2020, the organizers provided three curated data sets and challenged attendees to apply whichever algorithms and workflows they liked to integrate and interpret the data, in a series of ‘hackathons’. Unlike in-person hackathons, in which researchers intensively collaborate on software projects in shorts bursts over a few hours or days, these were virtual events held over a month, with collaborators dispersed around the globe. One event focused on Argelaguet’s mouse-embryo data set; the others concentrated on spatial-data-integration problems.
“We were interested to see what would be the challenges we should anticipate in multiomics,” Lê Cao says. “We thought that it would be good to gather the different experts in the field and see how they would approach the analysis of multiomic studies in single cells.”
Conventional single-cell experiments detail thousands of molecules at the expense of positional information. Spatial methods capture molecular identity without that dissociation step. By layering the two data types, researchers can compute the probable physical locations of dissociated cells, or flesh out spatial data sets with extra molecular detail.
“How a cell determines its fate, how it’s going to function, is a combination of many things,” says Marioni. “But something that’s very important is the physical location of the cell within the embryo: the mechanical pressures upon it, the local signalling environment, the shape of the embryo, how it’s changing through development. So, if we want to have a better understanding of cell-fate decisions, it’s really helpful to have these measurements in space.”
In one challenge, researchers were given both spatial and non-spatial RNA-expression data sets from a mouse visual cortex. They were then asked to use cell-type assignments computed in the non-spatial data to identify cell types in the spatial data, in which fewer genes are identified per cell. A second challenge asked whether it is possible to identify gene-expression signatures of cellular location in non-spatial transcriptional data. According to Fertig, the answer to that was mixed. “It depends on the data set and cell type,” she says.
Pratheepa Jeganathan, a statistician at McMaster University in Hamilton, Canada, tackled a third challenge, which involved protein-abundance data from different cohorts of people with breast cancer. Hackathon participants were tasked with integrating partially overlapping proteomics data sets; inferring the locations of cells for which no spatial data exist; and using non-spatial data to predict the expression levels of proteins that were not measured in the spatial data.
Attendees approached these hackathons mostly by repurposing existing algorithms, says Lê Cao. Her students used a machine-learning approach called partial least squares, which they originally developed for bulk genomics data. “We are piling up our knowledge and methods and tweaking them, so we don’t reinvent the wheel,” she says.
Jeganathan used topic analysis, a natural-language processing technique that she adapted during her postdoc, to infer how microbial communities differ across environments. In the hackathon, she adapted the method again, to characterize the spatial distribution and composition of cells across data sets. According to Culhane, that kind of information can be clinically useful, because the distribution of immune cells around a tumour can influence how well a person responds to therapy. “The spatial orientation of the cells was actually informative for patient survival,” she says.
Gene regulatory networks
Two omics data types are particularly useful for determining the molecular mechanisms underlying cellular development.
Single-cell RNA-seq data identify which genes are expressed in a given cell, whereas chromatin accessibility assays highlight regulatory regions. By integrating those, researchers can identify the regulatory elements that act on a gene, the transcription factors that probably control those elements and when and where those factors are expressed. The result is a gene-regulatory network that researchers can probe to tease apart how cells’ fates are determined.
Buenrostro and his team applied this strategy to show how chromatin opens up, or becomes primed, in advance of cellular differentiation in mouse skin. They were then able to use the cell’s ‘chromatin potential’ to predict how individual cells were likely to differentiate. Chromatin, Buenrostro explains, “should always point in the direction of differentiation”. His team has released a software package called FigR to help define these networks.
CellOracle, from Samantha Morris’s team at Washington University in St. Louis, Missouri, allows researchers to simulate the effect of impeding or boosting impact of transcription factors on cell identity. Morris worked with researchers in Milan, Italy, to see how specific transcription factors affect the development of brain cells called medium spiny neurons in human embryos, which would be impossible to do using genetic manipulation6. Separately, her team has computationally modified some 200 transcription factors to identify those that are involved in formation of the axial mesoderm in embryonic zebrafish (Danio rerio). The axial mesoderm develops into the notochord, a skeletal rod that supports the embryo’s body. The software predicted that the deletion of one of those transcription factors, noto, would not only prevent notochord development, which was already known, but also promote the growth of another developmental structure, which was not. When they knocked out noto in the lab, that is precisely what they saw. “We were able to predict a new phenotype in this knockout,” Morris says, “and then we validated that experimentally using single-cell RNA-seq.”
The kitchen sink
As the single-cell multiomics field accelerates, new tools are appearing at a dizzying pace. If cellular information can be captured by sequencing, single-cell biologists are folding it into their experiments.
In June, researchers in the United States and Japan described a method7 of simultaneously capturing three pieces of information: chromatin accessibility, cell-surface protein abundance and cellular lineage, the last of which is measured using mitochondrial DNA.
The team initially called its method ASAP-seq. But during the revision of the paper, 10x Genomics released a new microfluidics kit to simplify the collection of gene-expression and chromatin-accessibility data from the same cells, and the researchers decided to blend that kit with ASAP-seq to fold in yet another layer of information: transcription.
The team dubbed its method DOGMA-seq — a nod to the ‘central dogma of molecular biology’, which states that DNA is transcribed into RNA, and RNA is translated into proteins. Among other things, the technique revealed lineage biases during bone-marrow differentiation7.
“The fact that a new assay was introduced as a revision experiment above all speaks to the breakneck speed at which the single-cell field is moving,” says Caleb Lareau, a computational biologist at Stanford University, California, and a member of the team.
Researchers can only try to keep up. Such is the pace of development that Buenrostro jokes that his students’ minds “implode” with each new publication as they scramble to work out how it affects their research.
And Lareau says that he and his colleagues have pre-emptively named their successor to DOGMA-seq. Their working title? ‘Kitchen-seq’, as in: “How can you sequence everything but the kitchen sink?”
More News
Author Correction: Stepwise activation of a metabotropic glutamate receptor – Nature
Changing rainforest to plantations shifts tropical food webs
Streamlined skull helps foxes take a nosedive